Pages

Friday, October 26, 2012

NGC 4178


NGC 4178: A black hole located in the middle of the spiral galaxy NGC 4178.

One of the lowest mass supermassive black holes ever observed in the middle of a galaxy has been identified, thanks to NASA's Chandra X-ray Observatory and several other observatories. The black hole is located in the middle of the spiral galaxy NGC 4178, shown in this image from the Sloan Digital Sky Survey. The inset shows an X-ray source at the position of the black hole, in the center of a Chandra image. An analysis of the Chandra data, along with infrared data from NASA's Spitzer Space Telescope and radio data from the NSF's Very Large Array suggests that the black hole has a mass less than about 200,000 times that of the sun, near the extreme low-mass end of the supermassive black hole range. The host galaxy is of a type not expected to harbor supermassive black holes, suggesting that this black hole, while related to its supermassive cousins, may have a different origin.

Scale: Main image: 10 arcmin across (about 160,000 light years).

Image credit: X-ray: NASA/CXC/George Mason Univ/N.Secrest et al; Optical: SDSS

Note: For more information, see NGC 4178: Revealing a Mini-Supermassive Black Hole.

Thursday, October 25, 2012

The Milky Way


This striking view of the central parts of the Milky Way was obtained with the VISTA survey telescope at ESO’s Paranal Observatory in Chile. This huge picture is 108,500 by 81,500 pixels and contains nearly nine billion pixels. It was created by combining thousands of individual images from VISTA, taken through three different infrared filters, into a single monumental mosaic. These data form part of the VVV public survey and have been used to study a much larger number of individual stars in the central parts of the Milky Way than ever before. Because VISTA has a camera sensitive to infrared light it can see through much of the dust blocking the view for optical telescopes, although many more opaque dust filaments still show up well in this picture.

This image is too large to be easily displayed at full resolution and is best appreciated using the zoom tool. Read about the composition of this 9 gigapixel image in this newsletter.

Image credit: ESO/VVV Survey/D. Minniti
Acknowledgment: Ignacio Toledo, Martin Kornmesser

Notes: For more information, see 84 Million Stars and Counting. For those of you who are download junkies (and The Minister knows there are many of you who), be warned that the full-size original image comes in at a whopping 24.6 gigabytes!

Wednesday, October 17, 2012

A Planet around Alpha Centauri B


This artist’s impression shows the planet orbiting the star Alpha Centauri B, a member of the triple star system that is the closest to Earth. Alpha Centauri B is the most brilliant object in the sky and the other dazzling object is Alpha Centauri A. Our own Sun is visible to the upper right. The tiny signal of the planet was found with the HARPS spectrograph on the 3.6-meter telescope at ESO’s La Silla Observatory in Chile.

Illustration credit: ESO/L. Calçada/Nick Risinger

Note: For more information, see Planet Found in Nearest Star System to Earth.

Friday, October 12, 2012

Planetary Nebulae


Planetary Nebula Gallery: Four planetary nebulas located less than 5000 light years from Earth.

This gallery shows four planetary nebulas from the first systematic survey of such objects in the solar neighborhood made with NASA's Chandra X-ray Observatory. The planetary nebulas shown here are NGC 6543 (aka the Cat's Eye), NGC 7662, NGC 7009 and NGC 6826. X-ray emission from Chandra is colored purple and optical emission from the Hubble Space Telescope is colored red, green and blue. A planetary nebula is a phase of stellar evolution that the sun should experience several billion years from now, when it expands to become a red giant and then sheds most of its outer layers, leaving behind a hot core that contracts to form a dense white dwarf star. A wind from the hot core rams into the ejected atmosphere, creating the shell-like filamentary structures seen with optical telescopes. The diffuse X-ray emission is caused by shock waves as the wind collides with the ejected atmosphere. The properties of the X-ray point sources in the center of about half of the planetary nebulas suggest that many central stars responsible for ejecting planetary nebulas have companion stars.

Image credit: X-ray: NASA/CXC/RIT/J.Kastner et al.; Optical: NASA/STScI

Note: For more information, see NGC 6543: A Planetary Nebula Gallery.

Thursday, October 11, 2012

Spiral Structure Around R Sculptoris


Observations using the Atacama Large Millimeter/submillimeter Array (ALMA) have revealed an unexpected spiral structure in the material around the old star R Sculptoris. This feature has never been seen before and is probably caused by a hidden companion star orbiting the star. This slice through the new ALMA data reveals the shell around the star, which shows up as the outer circular ring, as well as a very clear spiral structure in the inner material.

Image credit: ALMA (ESO/NAOJ/NRAO)/M. Maercker et al.

Note: For more information, see Surprising Spiral Structure Spotted by ALMA.

Saturday, October 6, 2012

NGC 2359 - Thor's Helmet Nebula


This VLT image of the Thor’s Helmet Nebula was taken on the occasion of ESO’s 50th Anniversary, 5 October 2012, with the help of Brigitte Bailleul — winner of the Tweet Your Way to the VLT! competition. The observations were broadcast live over the Internet from the Paranal Observatory in Chile. This object, also known as NGC 2359, lies in the constellation of Canis Major (The Great Dog). The helmet-shaped nebula is around 15,000 light-years away from Earth and is over 30 light-years across. The helmet is a cosmic bubble, blown as the wind from the bright, massive star near the bubble's center sweeps through the surrounding molecular cloud.

Photo credit: ESO/B. Bailleul

Note: For more information, see ESO Celebrates its 50th Anniversary.

Thursday, September 27, 2012

Head of the Seagull Nebula


This image from ESO’s La Silla Observatory shows part of a stellar nursery nicknamed the Seagull Nebula. This cloud of gas, known as Sh 2-292, RCW 2 and Gum 1, seems to form the head of the seagull and glows brightly due to the energetic radiation from a very hot young star lurking at its heart. The detailed view was produced by the Wide Field Imager on the MPG/ESO 2.2-meter telescope.

Photo credit: ESO

Note: For more information, see The Rich Colors of a Cosmic Seagull

Tuesday, September 25, 2012

Halo of Hot Gas Around the Milky Way


Galactic Halo: An enormous halo of hot gas (in blue) around the Milky Way galaxy with a radius of at least 300,000 light years.

Astronomers have used Chandra to find evidence that our Milky Way Galaxy is embedded in an enormous halo of hot gas that extends for hundreds of thousands of light years. This artist's illustration shows the halo of hot gas, in blue, around the Milky Way and two small neighboring galaxies. The mass of the halo is estimated to be comparable to the mass of all the stars in the Milky Way galaxy. If the size and mass of this gas halo is confirmed, it could be the solution to the "missing-baryon" problem for the Galaxy.

Illustration credit: NASA/CXC/M.Weiss; NASA/CXC/Ohio State/A Gupta et al.

Note: For more information, see Galactic Halo: Milky Way is Surrounded by Huge Halo of Hot Gas.

Wednesday, September 19, 2012

Juno's Two Deep Space Maneuvers are 'Back-To-Back Home Runs'


NASA's Juno spacecraft successfully executed a second Deep Space Maneuver, called DSM-2 last Friday, September 14. The 30 minute firing of its main engine refined the Jupiter-bound spacecraft's trajectory, setting the stage for a gravity assist from a flyby of Earth on October 9, 2013. Juno will arrive at Jupiter on July 4, 2016.

The maneuver began at 3:30 p.m. PDT (6:30 p.m. EDT), when the Leros-1b main engine began to fire. The burn ended at 4 p.m. PDT (7 p.m. EDT). Based on telemetry, the Juno project team believes the burn was accurate, changing the spacecraft's velocity by about 867 mph (388 meters a second) while consuming about 829 pounds (376 kilograms) of fuel.

The burn occurred when Juno was more than 298 million miles (480 million kilometers) from Earth.

Juno executed its first deep space maneuver (DSM-1), one of comparable duration and velocity change, on August 30. Together, both maneuvers placed Juno on course for its Earth flyby, which will occur as the spacecraft is completing one elliptical orbit around the sun. The Earth flyby will boost Juno's velocity by 16,330 mph (about 7.3 kilometers per second), placing the spacecraft on its final flight path for Jupiter. The closest approach to Earth, on October 9, 2013, will occur when Juno is at an altitude of about 348 miles (560 kilometers).

"It feels like we hit back-to-back home runs here with the near-flawless propulsion system performance seen during both DSM-1 and DSM-2." said Juno Project Manager Rick Nybakken of NASA's Jet Propulsion Laboratory in Pasadena, California. "These successes move us closer to being ready for our most critical mission event, the Jupiter Orbit Insertion main engine burn in July 2016. We're not in the playoffs yet, as that will come in 2016 when we arrive at Jupiter, but it does feel fantastic to have hit both of these DSMs out of the park."

Juno was launched on August 5, 2011. Once in orbit, the spacecraft will circle Jupiter 33 times, from pole to pole, and use its collection of eight science instruments to probe beneath the gas giant's obscuring cloud cover. Juno's science team will learn about Jupiter's origins, structure, atmosphere and magnetosphere, and look for a potential solid planetary core.

Juno's name comes from Greek and Roman mythology. The god Jupiter drew a veil of clouds around himself to hide his mischief, and his wife, the goddess Juno, was able to peer through the clouds and reveal Jupiter's true nature.

Illustration credit: NASA/JPL-Caltech

Tuesday, September 18, 2012

New Impact Crater South of Echus Chasma


How exactly can we tell if an impact crater is new?

In this observation, we see a dark spot with a larger, rayed "blast zone" that was also apparent in a Context Camera image taken in 2011 (an instrument with a larger footprint than HiRISE and also on the Mars Reconnaissance Orbiter). However, a THEMIS image of the same area acquired in 2009 does not show the dark spot at all.

This is a great example of using three different instruments to view the same area not only to look for changes in the Martian landscape, but also to use the resolution of HiRISE to determine if this is indeed a new impact site.

Photo credit: NASA/JPL/University of Arizona

Note: This impact crater is located just south of Echus Chasma.

Monday, September 17, 2012

Bs in the Beehive


Astronomers have discovered two gas giant planets orbiting stars in the Beehive cluster, a collection of about 1,000 tightly packed stars. The planets are the first ever found around sun-like stars in a cluster of stars. Such planets, even though they are not habitable, would have skies filled with many bright stars as illustrated in this artist's concept. A gas giant planet is shown to the right of its sun-like star, and all around, the stars of the Beehive cluster shine brightly in the dark.


This image of the Beehive star cluster points out the location of its first known planets, Pr0201b and Pr0211b, or, as astronomers call them, the first 'b's' in the Beehive. The "open cluster," also called Praesepe, is a collection of about 1,000 stars all loosely bound together by gravity, located about 550 light-years away. The stars were born out of the same cloud and have remained together for the past 600 million years. Eventually, they will disperse and head out on their own.

Astronomers found the planets Pr0201b and Pr0211b orbiting different sun-like stars in the cluster. The planets are both "hot Jupiters," which are gas giants like Jupiter but whip closely around their stars in just days. They are the first planets ever found around sun-like stars in a cluster, offering further proof that planets can sprout up in dense stellar environments.

The Beehive cluster can be seen in dark northern skies in late winter or early spring with the naked eye. The stars themselves can be seen individually with the help of a telescope.

Illustration credit: NASA/JPL-Caltech; image credit: Stuart Heggie

Note: For more information, see First Planets Found Around Sun-Like Stars in a Cluster.

Sunday, September 16, 2012

SN 1604 - Kepler's Supernova Remnant


Kepler's Supernova Remnant: The debris from a supernova observed in 1604.

This composite image of Kepler's supernova remnant shows different colors ranging from lower to higher energies: red, yellow, green, blue and purple. An optical image from the Digitized Sky Survey (pale yellow and blue) shows stars in the field. The Kepler supernova was a Type Ia event, the thermonuclear explosion of a white dwarf. New analysis suggests that the supernova explosion was not only more powerful, but might have also occurred at a greater distance, than previously thought.

Scale: Image is about 5 arcmin across (19-33 light years).

Image credit: X-ray: NASA/CXC/SAO/D.Patnaude, Optical: DSS


Note: For more information, see Kepler's Supernova Remnant: Was Kepler's Supernova Unusually Powerful?

Saturday, September 15, 2012

Colorful Surface Near Nili Fossae


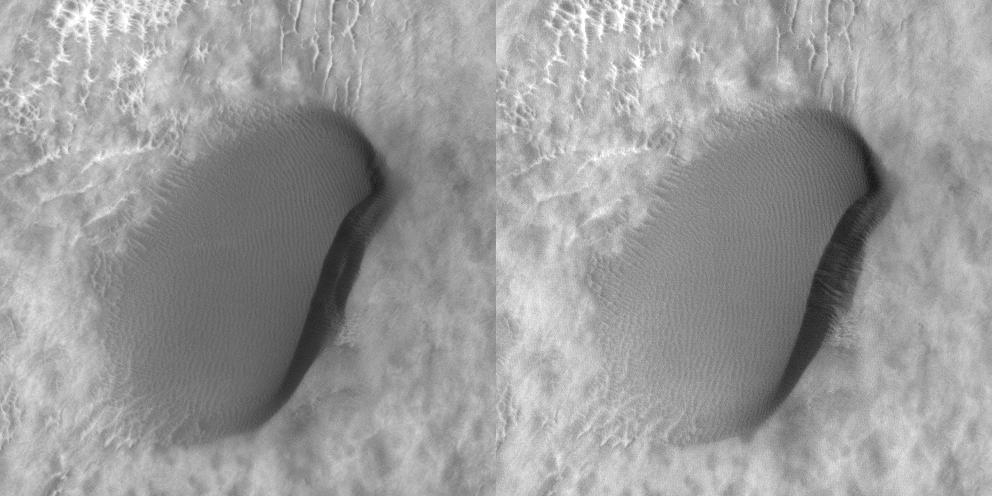
This enhanced-color image shows a surface with diverse colors just southwest of Nili Fossae. The color diversity of this mesa suggests that the surface has a varied composition, perhaps recording chemical processes of ancient Mars.

Much of the surface shows a chaotic mix of colors, but the northern impact crater exposes distinct layers. Different layers have different colors. There are several possible reasons for this: the events that formed the layers could have drawn material from different sources, or the layers could have been altered differently after they formed, for reasons such as varying porosity.

This is a stereo pair with ESP_019898_2000.

Photo credit: NASA/JPL/University of Arizona

Friday, September 14, 2012

NGC 2736 - The Pencil Nebula


The oddly shaped Pencil Nebula (NGC 2736) is pictured in this image from ESO’s La Silla Observatory in Chile. This nebula is a small part of a huge remnant left over after a supernova explosion that took place about 11,000 years ago. The image was produced by the Wide Field Imager on the MPG/ESO 2.2-meter telescope at ESO’s La Silla Observatory in Chile.

Photo credit: ESO

Note: For more information, see A Celestial Witch’s Broom?


Thursday, September 13, 2012

Full Topographical Maps of Vesta


This image from NASA's Dawn mission shows the topography of the northern and southern hemispheres of the giant asteroid Vesta, updated with pictures obtained during Dawn's last look back. Around the time of Dawn's departure from Vesta in the late summer of 2012, dawn was beginning to creep over the high northern latitudes, which were dark when Dawn arrived in the summer of 2011.

These color-shaded relief maps show the northern and southern hemispheres of Vesta, derived from images analysis. Colors represent distance relative to Vesta's center, with lows in violet and highs in red. In the northern hemisphere map on the left (Figure 1), the surface ranges from lows of minus 13.82 miles (22.24 kilometers) to highs of 27.48 miles (44.22 kilometers). Light reflected off the walls of some shadowed craters at the north pole (in the center of the image) was used to determine the height. In the southern hemisphere map on the right (Figure 2), the surface ranges from lows of minus 23.65 miles (38.06 kilometers) to 26.61 miles (42.82 kilometers).

The shape model was constructed using images from Dawn's framing camera that were obtained from July 17, 2011, to August 26, 2012. The data have been stereographically projected on a 300-mile-diameter (500-kilometer-diameter) sphere with the poles at the center.

The three craters that make up Dawn's "snowman" feature can be seen at the top of the northern hemisphere map on the left. A mountain more than twice the height of Mount Everest, inside the largest impact basin on Vesta, can be seen near the center of the southern hemisphere map on the right.

These images are the last in Dawn's Image of the Day series during the cruise to Dawn's second destination, Ceres. A full set of Dawn data is being archived at http://pds.nasa.gov/.

Image credit: NASA/JPL-Caltech/UCAL/MPS/DLR/IDA/PSI

Note: For more information, see Vesta in Dawn's Rear View Mirror.

Wednesday, September 12, 2012

Let it snow, let is snow, let it...


Observations by NASA's Mars Reconnaissance Orbiter have detected carbon-dioxide snow clouds on Mars and evidence of carbon-dioxide snow falling to the surface.

Deposits of small particles of carbon-dioxide ice are formed by snowfall from carbon-dioxide clouds. This map shows the distribution of small-grain carbon-dioxide ice deposits formed by snowfall over the south polar cap of Mars. It is based on infrared measurements by the Mars Climate Sounder instrument on the Mars Reconnaissance Orbiter.

Image credit: NASA/JPL-Caltech

Note: For more information, see NASA Observations Point to 'Dry Ice' Snowfall on Mars.

Tuesday, September 11, 2012

B-Ring Clumps and Strands


Zooming in on clumps in Saturn’s B-ring (lower left), the image also spans the ringlets of the Cassini Division towards the A-ring in the top right. The view looks toward the sunlit side of the rings from about 31 degrees below the ring plane. The image scale is approximately 2 km per pixel.

Photo credit: NASA/JPL/Space Science Institute

Monday, September 10, 2012

3-D View from Bradbury Landing


This 3-D image from NASA's Curiosity was taken from the rover's Bradbury Landing site inside Gale Crater, Mars, using the left and right eyes of its Navigation camera. Between the rover on the right, and its shadow on the left, looms the rover's eventual target: Mount Sharp. The mountain's highest peak is not visible to the rover from the landing site.

This full-resolution, 360-degree stereo panorama was taken on sols 2 and 12 of the mission, or the 2nd and 12th Martian days since landing (Aug. 8 and 18, 2012). It requires viewing with the traditional red-blue 3-D glasses, with red going over the left eye.

Image credit: NASA/JPL-Caltech

Sunday, September 9, 2012

Hadley Crater


High-Resolution Stereo Camera (HRSC) nadir and color channel data taken during revolution 10572 on 9 April 2012 by ESA’s Mars Express have been combined to form a natural-color view of Hadley Crater. Centered at around 19°S and 157°E, the image has a ground resolution of about 19 m per pixel. The image shows the main 120 km wide crater, with subsequent impacts at later epochs within it. Evidence of these subsequent impacts occurring over large timescales is shown by some of the craters being buried.

Photo credit: ESA/DLR/FU Berlin (G. Neukum)

Saturday, September 8, 2012

Chernozem Cropland


This ALOS satellite image shows an area with extensive agricultural use in western Russia, with roads and rivers cutting through the cropland. This area, part of Russia’s Black Earth Region, is about 400 km directly south of Moscow. Many grains are grown here, such as winter wheat and rye.

This image is a compilation of three passes by the Japanese Advanced Land Observation Satellite’s radar on 14 June 2009, 14 September 2009 and 2 August 2010. Each image at the different recording date is assigned a color (red, green or blue) and combined to produce this representation. The colors reveal changes in the surface between the satellite’s passes.

Photo credit: JAXA, ESA

Friday, September 7, 2012

ARP 116


Two very different galaxies feature in this image taken by the NASA/ESA Hubble Space Telescope, forming a peculiar galaxy pair called Arp 116.

Arp 116 is composed of a giant elliptical galaxy known as Messier 60, and a much smaller spiral galaxy, NGC 4647.

Astronomers have long tried to determine whether these two galaxies are actually interacting. Although they overlap as seen from Earth, there is no evidence of new star formation, which would be one of the clearest signs that the two galaxies are indeed interacting. However, recent studies of very detailed Hubble images suggest the onset of some tidal interaction between the two.

Photo credit: NASA, ESA

Note: For more information, see A Family Portrait of Galaxies.

Thursday, September 6, 2012

Messier 4


This image from the Wide Field Imager attached to the MPG/ESO 2.2-metre telescope at ESO’s La Silla Observatory shows the spectacular globular star cluster Messier 4. This great ball of ancient stars is one of the closest of such stellar systems to the Earth and appears in the constellation of Scorpius (The Scorpion) close to the bright red star Antares.

Photo credit: ESO

Note: For more information, see A Cluster With a Secret.

Wednesday, September 5, 2012

August Blue Moon


The second full Moon of the month – known as a ‘blue’ Moon – just before it disappeared from the MSG-3 satellite’s sight behind the southern hemisphere. The image was captured by the Spinning Enhanced Visible and Infrared Imager (SEVIRI) instrument at 11:20 GMT on 31 August 2012.

Photo credit: Eumetsat

Tuesday, September 4, 2012

Arctic Ice Cover Decrease


This animation shows Arctic ice cover from 1978 to 2010. The past five years have seen the lowest Arctic sea-ice extent since satellite measurements began in the 1970s.

Video credit: ESA/DLR

Friday, August 31, 2012

NGC 1929


NGC 1929: A star cluster embedded within the N44 nebula, which is located about 160,000 light years from Earth.

The star cluster NGC 1929 contains massive stars that produce intense radiation, expel matter at high speeds, and race through their evolution to explode as supernovas. The winds and shock waves carve out huge cavities called superbubbles in the surrounding gas. X-rays from Chandra (blue) in this composite image reveal the regions created by these winds and shocks, while infrared data from Spitzer (red) outline where the dust and cooler gas are found. Optical light from an ESO telescope in Chile (yellow) shows where ultraviolet radiation from the young stars is causing the gas to glow.

Scale: Image is: 25 arcmin across (1200 light years).

Image credit: X-ray: NASA/CXC/U.Mich./S.Oey, IR: NASA/JPL, Optical: ESO/WFI/2.2-m)

Note: For more information, see NGC 1929 in N44: A Surprisingly Bright Superbubble.

Thursday, August 30, 2012

Rho Ophiuchi Nebula


This image shows the Rho Ophiuchi star-forming region in infrared light, as seen by NASA’s Wide-field Infrared Explorer (WISE). Blue and cyan represent light emitted at wavelengths of 3.4 and 4.6 micrometers, which is predominantly from stars. Green and red represent light from 12 and 22 micrometers, respectively, which is mostly emitted by dust.

Photo credit: NASA/JPL-Caltech/WISE Team

Note: For more information, see Sweet Result from ALMA.

Sunday, August 26, 2012

Neil Armstrong, 1930-2012


The following is a statement from NASA Administrator Charles Bolden regarding the death of former test pilot and NASA astronaut Neil Armstrong. He was 82.

"On behalf of the entire NASA family, I would like to express my deepest condolences to Carol and the rest of Armstrong family on the passing of Neil Armstrong. As long as there are history books, Neil Armstrong will be included in them, remembered for taking humankind's first small step on a world beyond our own.

"Besides being one of America's greatest explorers, Neil carried himself with a grace and humility that was an example to us all. When President Kennedy challenged the nation to send a human to the moon, Neil Armstrong accepted without reservation.

"As we enter this next era of space exploration, we do so standing on the shoulders of Neil Armstrong. We mourn the passing of a friend, fellow astronaut and true American hero."

Photo credit: NASA

Note: For more information, see neilarmstronginfo.com

Saturday, August 25, 2012

Phobos Anaglyph


Mars Express HRSC (High Resolution Stereo Camera) image of Phobos taken on 9 January 2011 at a distance of 100 km with a resolution of 8.1 m/pixel. Use red-blue glasses to fully appreciate this image.

Phobos is approximately 27 × 22 × 18 km and orbits Mars at a distance of 6000 km above the planet’s surface, or 9400 km from the center of the planet.

Photo credit: ESA/DLR/FU Berlin (G. Neukum)

Saturday, August 18, 2012

The Phoenix Cluster


The image on the left shows the newly discovered Phoenix Cluster, located about 5.7 billion light years from Earth. This composite includes an X-ray image from NASA's Chandra X-ray Observatory in purple, an optical image from the 4m Blanco telescope in red, green and blue, and an ultraviolet (UV) image from NASA's Galaxy Evolution Explorer (GALEX) in blue. The Chandra data show hot gas in the cluster and the optical and UV images show galaxies in the cluster and in nearby parts of the sky.

This galaxy cluster has been dubbed the "Phoenix Cluster" because it is located in the constellation of the Phoenix, and because of its remarkable properties, as explained here and in our press release. Stars are forming in the Phoenix Cluster at the highest rate ever observed for the middle of a galaxy cluster. The object is also the most powerful producer of X-rays of any known cluster, and among the most massive of clusters. The data also suggest that the rate of hot gas cooling in the central regions of the cluster is the largest ever observed.

Like other galaxy clusters, Phoenix contains a vast reservoir of hot gas -- containing more normal matter than all of the galaxies in the cluster combined -- that can only be detected with X-ray telescopes like Chandra. This hot gas is giving off copious amounts of X-rays and cooling quickly over time, especially near the center of the cluster, causing gas to flow inwards and form huge numbers of stars. These features are shown in the artist's impression of the central galaxy, with hot gas in red, cooler gas in blue. The gas flows appear as the ribbon-like features and the newly formed stars are blue. An animation portrays the process of cooling and star formation in action. A close-up of the middle of the optical and UV image shows that the central galaxy has much bluer colors than the nearby galaxies in the cluster, revealing the presence of large numbers of hot, massive stars forming.

These results are striking because most galaxy clusters have formed very few stars over the last few billion years. Astronomers think that the supermassive black hole in the central galaxy of clusters pumps energy into the system. The famous Perseus Cluster is an example of a black hole bellowing out energy and preventing the gas from cooling to form stars at a high rate. Repeated outbursts from the black hole in the center of Perseus in the form of powerful jets, created giant cavities and produced sound waves with an incredibly deep B-flat note 57 octaves below middle C. Shock waves, akin to sonic booms in Earth's atmosphere, and the very deep sound waves release energy into the gas in Perseus, preventing most of it from cooling.

In the case of Phoenix, jets from the giant black hole in its central galaxy are not powerful enough to prevent the cluster gas from cooling. Correspondingly, any deep notes produced by the jets must be much weaker than needed to prevent cooling and star formation.

Based on the Chandra data and also observations at other wavelengths, the supermassive black hole in the central galaxy of Phoenix is growing very quickly, at a rate of about 60 times the mass of the Sun every year. This rate is unsustainable, because the black hole is already very large with a mass of about 20 billion times the mass of the Sun. Therefore, its growth spurt cannot last much longer than about a hundred million years or it would become much bigger than its counterparts in the nearby Universe. A similar argument applies to the growth of the central galaxy. Eventually powerful jets should be produced by the black hole in repeated outbursts, forming the deep notes seen in objects like Perseus and stopping the starburst.

The Phoenix Cluster was originally detected by the South Pole Telescope, using the Sunyaev-Zeldovich effect, as explained in more detail in a blog interview with the first author of the paper, Michael McDonald. In a separate article more details about the Sunyaev-Zeldovich effect are given, including a historical perspective, in an interview with one of its co-discoverers, Rashid Sunyaev.

Photo and illustration credits: X-ray: NASA/CXC/MIT/M.McDonald; UV: NASA/JPL-Caltech/M.McDonald; Optical: AURA/NOAO/CTIO/MIT/M.McDonald; Illustration: NASA/CXC/M.Weiss

Friday, August 17, 2012

Barnard 59, The Pipe Nebula


This picture shows Barnard 59, part of a vast dark cloud of interstellar dust called the Pipe Nebula. This new and very detailed image of what is known as a dark nebula was captured by the Wide Field Imager on the MPG/ESO 2.2-meter telescope at ESO’s La Silla Observatory.

Photo credit: ESO

Note: For more information, see Ceci N’est Pas Une Pipe.

Thursday, August 16, 2012

Meteor Smoke and Noctilucent Clouds


Anyone who's ever seen a noctilucent cloud or “NLC” would agree: They look alien. The electric-blue ripples and pale tendrils of NLCs reaching across the night sky resemble something from another world.

Researchers say that's not far off. A key ingredient for the mysterious clouds comes from outer space.

"We've detected bits of 'meteor smoke' embedded in noctilucent clouds," reports James Russell of Hampton University, principal investigator of NASA's AIM mission to study the phenomenon. "This discovery supports the theory that meteor dust is the nucleating agent around which NLCs form."

Noctilucent clouds are a mystery dating back to the late 19th century. Northern sky watchers first noticed them in 1885 about two years after the eruption of Krakatoa. Ash from the Indonesian volcano caused such splendid sunsets that evening sky watching became a worldwide pastime. One observer in particular, a German named T.W. Backhouse who is often credited with the discovery of NLCs, noticed something odd. He stayed outside longer than most people, long enough for the twilight to fully darken, and on some nights he saw wispy filaments glowing electric blue against the black sky. Scientists of the day figured they were some manifestation of volcanic dust.

Eventually Krakatoa’s ash settled and the sunsets faded, but strangely the noctilucent clouds didn’t go away. They’re still present today, stronger than ever. Researchers aren’t sure what role Krakatoa’s ash played in those early sightings. One thing is clear, however: The dust behind the clouds we see now is space dust.

Mark Hervig of the company GATS, Inc, led the team that found the extraterrestrial connection.

"Using AIM's Solar Occultation for Ice Experiment (SOFIE), we found that about 3% of each ice crystal in a noctilucent cloud is meteoritic," says Hervig.

The inner solar system is littered with meteoroids of all shapes and sizes--from asteroid-sized chunks of rock to microscopic specks of dust. Every day Earth scoops up tons of the material, mostly the small stuff. When meteoroids hit our atmosphere and burn up, they leave behind a haze of tiny particles suspended 70 km to 100 km above Earth's surface.

It's no coincidence that NLCs form 83 km high, squarely inside the meteor smoke zone.

Specks of meteor smoke act as gathering points where water molecules can assemble themselves into ice crystals. The process is called "nucleation."

Nucleation happens all the time in the lower atmosphere. In ordinary clouds, airborne specks of dust and even living microbes can serve as nucleation sites. Tiny ice crystals, drops of water, and snowflakes grow around these particles, falling to Earth if and when they become heavy enough.

Nucleating agents are especially important in the ethereal realm of NLCs. The clouds form at the edge of space where the air pressure is little more than vacuum. The odds of two water molecules meeting is slim, and of sticking together slimmer still.

Meteor smoke helps beat the odds. According AIM data, ice crystals can grow around meteoritic dust to sizes ranging from 20 to 70 nanometers. For comparison, cirrus clouds in the lower atmosphere where water is abundant contain crystals 10 to 100 times larger.

The small size of the ice crystals explains the clouds' blue color. Small particles tend to scatter short wavelengths of light (blue) more strongly than long wavelengths (red). So when a beam of sunlight hits an NLC, blue is the color that gets scattered down to Earth.

Meteor smoke explains much about NLCs, but a key mystery remains: Why are the clouds brightening and spreading?

In the 19th century, NLCs were confined to high latitudes—places like Canada and Scandinavia. In recent times, however, they have been spotted as far south as Colorado, Utah and Nebraska. The reason, Russell believes, is climate change. One of the greenhouse gases that has become more abundant in Earth's atmosphere since the 19th century is methane. It comes from landfills, natural gas and petroleum systems, agricultural activities, and coal mining.

It turns out that methane boosts NLCs.

Russell explains: "When methane makes its way into the upper atmosphere, it is oxidized by a complex series of reactions to form water vapor. This extra water vapor is then available to grow ice crystals for NLCs."

If this idea is correct, noctilucent clouds are a sort of "canary in a coal mine" for one of the most important greenhouse gases.

And that, says Russell, is a great reason to study them. "Noctilucent clouds might look alien, but they're telling us something very important about our own planet."


Photo credit: NASA; video credit: NASA

Wednesday, August 15, 2012

SNR G272.2-03.2


Composite optical and X-ray picture of supernova remnant G272.2-03.2, taken on 11 December 2001 by ESA’s XMM-Newton. The remnant was discovered in 1994 with ROSAT. The image is 40 x 40 arc minutes.

Photo credit: XMM-Newton/ESA

Tuesday, August 14, 2012

Soyuz Docked to the ISS


ESA astronaut André Kuipers looks at night-time Earth from his vantage point on the International Space Station. A Russian Progress ferry and his Soyuz spacecraft (left) are attached to the Station.

Photo credit: ESA/NASA

Note: This image is of the eastern Mediterranean Ocean with the Nile River and its delta being the long meandering line of lights in the distance; Cairo is the bright spot at the base of the delta. Israel is the bright patch of lights to the lower left, behind the Soyuz spacecraft, and you can just barely see a sliver of Cyprus at the bottom right.

Monday, August 13, 2012

Gale Crater Panorama


This is the first 360-degree panorama in color of the Gale Crater landing site taken by NASA's Curiosity rover. The panorama was made from thumbnail versions of images taken by the Mast Camera.

Scientists will be taking a closer look at several splotches in the foreground that appear gray. These areas show the effects of the descent stage's rocket engines blasting the ground. What appeared as a dark strip of dunes in previous, black-and-white pictures from Curiosity can also be seen along the top of this mosaic, but the color images also reveal additional shades of reddish brown around the dunes, likely indicating different textures or materials.

The images were taken late August 8 PDT (August 9 EDT) by the 34-millimeter Mast Camera. This panorama mosaic was made of 130 images of 144 by 144 pixels each. Selected full frames from this panorama, which are 1,200 by 1,200 pixels each, are expected to be transmitted to Earth later. The images in this panorama were brightened in the processing. Mars only receives half the sunlight Earth does and this image was taken in the late Martian afternoon.

Photo credit: NASA/JPL-Caltech/MSSS

Note: For more information, see NASA's Curiosity Beams Back a Color 360 of Gale Crater.

Sunday, August 12, 2012

Signs Changing Fast for Voyager at Solar System Edge


Two of three key signs of changes expected to occur at the boundary of interstellar space have changed faster than at any other time in the last seven years, according to new data from NASA's Voyager 1 spacecraft.

For the last seven years, Voyager 1 has been exploring the outer layer of the bubble of charged particles the sun blows around itself. In one day, on July 28, data from Voyager 1's cosmic ray instrument showed the level of high-energy cosmic rays originating from outside our solar system jumped by five percent. During the last half of that same day, the level of lower-energy particles originating from inside our solar system dropped by half. However, in three days, the levels had recovered to near their previous levels.

A third key sign is the direction of the magnetic field, and scientists are eagerly analyzing the data to see whether that has, indeed, changed direction. Scientists expect that all three of these signs will have changed when Voyager 1 has crossed into interstellar space. A preliminary analysis of the latest magnetic field data is expected to be available in the next month.

"These are thrilling times for the Voyager team as we try to understand the quickening pace of changes as Voyager 1 approaches the edge of interstellar space," said Edward Stone, the Voyager project scientist based at the California Institute of Technology, Pasadena, California. "We are certainly in a new region at the edge of the solar system where things are changing rapidly. But we are not yet able to say that Voyager 1 has entered interstellar space."

The levels of high-energy cosmic ray particles have been increasing for years, but more slowly than they are now. The last jump -- of five percent -- took one week in May. The levels of lower-energy particles from inside our solar system have been slowly decreasing for the last two years. Scientists expect that the lower-energy particles will drop close to zero when Voyager 1 finally crosses into interstellar space.

"The increase and the decrease are sharper than we've seen before, but that's also what we said about the May data," Stone said. "The data are changing in ways that we didn't expect, but Voyager has always surprised us with new discoveries."

Voyager 1, which launched on September 5, 1977, is 11 billion miles (18 billion kilometers) from the sun. Voyager 2, which launched on August 20, 1977, is close behind, at 9.3 billion miles (15 billion kilometers) from the sun.

"Our two veteran Voyager spacecraft are hale and healthy as they near the 35th anniversary of their launch," said Suzanne Dodd, Voyager project manager based at NASA's Jet Propulsion Laboratory, Pasadena. "We know they will cross into interstellar space. It's just a question of when."

Illustration credit: NASA/JPL-Caltech

Note: This story was actually released by JPL on August 3rd, but had to be pushed back due to other stories, especially those related to Curiosity.

Saturday, August 11, 2012

Star Formation in the Small Magellanic Cloud


This image shows the Small Magellanic Cloud galaxy in infrared light from the Herschel Space Observatory, a European Space Agency-led mission, and NASA's Spitzer Space Telescope. Considered dwarf galaxies compared to the big spiral of the Milky Way, the Large and Small Magellanic Clouds are the two biggest satellite galaxies of our home galaxy.

In combined data from Herschel and Spitzer, the irregular distribution of dust in the Small Magellanic Cloud becomes clear. A stream of dust extends to the left in this image, known as the galaxy's "wing," and a bar of star formation appears on the right.

The colors in this image indicate temperatures in the dust that permeates the Cloud. Colder regions show where star formation is at its earliest stages or is shut off, while warm expanses point to new stars heating surrounding dust. The coolest areas and objects appear in red, corresponding to infrared light taken up by Herschel's Spectral and Photometric Imaging Receiver at 250 microns, or millionths of a meter. Herschel's Photodetector Array Camera and Spectrometer fills out the mid-temperature bands, shown here in green, at 100 and 160 microns. The warmest spots appear in blue, courtesy of 24- and 70-micron data from Spitzer.

Photo credit: ESA/NASA/JPL-Caltech/STScI

Friday, August 10, 2012

Cluster Spacecraft Flying Through the Thin Boundary in the Magnetotail


This illustration shows the magnetic environment of Earth, which arises from the interaction between the solar wind, a stream of electrically charged particles released by the Sun, and our planet's internal magnetic field. In fact, the magnetosphere acts as a shield that prevents most of the solar wind particles from infiltrating Earth's atmosphere.

Highlighted in purple is the plasma sheet boundary layer, a thin boundary in the magnetotail – the long and cylindrical end of the magnetosphere that extends in the direction opposite the Sun. This thin boundary divides various regions of the magnetotail, which are populated by plasma with significantly different properties. To the north and south of the boundary are the lobes, two plasma layers characterized by very low density and strong magnetic field. Enclosed within the thin boundary is the plasma sheet, a denser layer where the magnetic field is weaker than in the lobes. Due to the drastically different properties of plasma at either side, thin boundaries such as the one in the magnetotail host most of the energy exchanges that take place in a plasma.

In the illustration, the four spacecraft of ESA's Cluster mission are shown as they fly in the magnetotail, in the configuration they had on 31 August 2007: two of them were separated by only a few tens of kilometers and located in the thin boundary of the magnetotail, while the other two were much farther away. This was a very favorable event to probe the behavior of plasma on the small scales where electrons become dominant. Using data from this event, scientists have for the first time characterized lower hybrid drift waves – plasma waves that develop in thin boundaries and play an important role in the dynamics of electrons and in the transfer of energy between different layers of plasma in Earth's magnetosphere.

Illustration credit: ESA / AOES Medialab

Note: For more information, see Cluster Looks into Waves in the Magnetosphere's Thin Boundaries.

Wednesday, August 8, 2012

Curiosity Descending Into Gale Crater


NASA's Curiosity rover and its parachute were spotted by NASA's Mars Reconnaissance Orbiter as Curiosity descended to the surface on August 5 PDT (August 6 EDT). The High-Resolution Imaging Science Experiment (HiRISE) camera captured this image of Curiosity while the orbiter was listening to transmissions from the rover. Curiosity and its parachute are in the center of the white box; the inset image is a cutout of the rover stretched to avoid saturation. The rover is descending toward the etched plains just north of the sand dunes that fringe "Mt. Sharp." From the perspective of the orbiter, the parachute and Curiosity are flying at an angle relative to the surface, so the landing site does not appear directly below the rover.

The parachute appears fully inflated and performing perfectly. Details in the parachute, such as the band gap at the edges and the central hole, are clearly seen. The cords connecting the parachute to the back shell cannot be seen, although they were seen in the image of NASA's Phoenix lander descending, perhaps due to the difference in lighting angles. The bright spot on the back shell containing Curiosity might be a specular reflection off of a shiny area. Curiosity was released from the back shell sometime after this image was acquired.

This view is one product from an observation made by HiRISE targeted to the expected location of Curiosity about one minute prior to landing. It was captured in HiRISE CCD RED1, near the eastern edge of the swath width (there is a RED0 at the very edge). This means that the rover was a bit further east or downrange than predicted.

The image scale is 13.2 inches (33.6 centimeters) per pixel.

Photo credit: NASA/JPL-Caltech/Univ. of Arizona

Note: For more information, see NASA's Curiosity Rover Caught in the Act of Landing.

Tuesday, August 7, 2012

First Images from Curiosity


This image shows one of the first views from NASA's Curiosity rover, which landed on Mars the evening of August 5 PDT (early morning hours August 6 EDT). It was taken through a "fisheye" wide-angle lens on one of the rover's Hazard-Avoidance cameras. These engineering cameras are located at the rover's base. As planned, the early images are lower resolution. Larger color images are expected later in the week when the rover's mast, carrying high-resolution cameras, is deployed.

Photo credit: NASA/JPL-Caltech


This is one of the first images taken by NASA's Curiosity rover, which landed on Mars the evening of August 5 PDT (morning of August 6 EDT). It was taken through a "fisheye" wide-angle lens on the left "eye" of a stereo pair of Hazard-Avoidance cameras on the left-rear side of the rover. The image is one-half of full resolution. The clear dust cover that protected the camera during landing has been sprung open. Part of the spring that released the dust cover can be seen at the bottom right, near the rover's wheel.

On the top left, part of the rover's power supply is visible.

Some dust appears on the lens even with the dust cover off.

The cameras are looking directly into the sun, so the top of the image is saturated. Looking straight into the sun does not harm the cameras. The lines across the top are an artifact called "blooming" that occurs in the camera's detector because of the saturation.

As planned, the rover's early engineering images are lower resolution. Larger color images from other cameras are expected later in the week when the rover's mast, carrying high-resolution cameras, is deployed.

Photo credit: NASA/JPL-Caltech


Notes: For more information on the lower photo see NASA's New Mars Rover Sends Higher-Resolution Image. Are these blueberries in the sand?

Monday, August 6, 2012

Cloudy with a chance of...


This global map of Mars was acquired on August 2, 2012, by the Mars Color Imager instrument on NASA's Mars Reconnaissance Orbiter. One global map is generated each day to forecast weather conditions for the entry, descent and landing of NASA's Curiosity rover. The active dust storm observed south of Curiosity's landing site on July 31 has dissipated, leaving behind a dust cloud that will not pose a threat to the landing.

The map is a rectangular projection of Mars (from 90 degrees latitude to minus 90 degrees latitude, and minus 180 degrees longitude to 180 degrees east longitude). The landing site is located on the right side of the map, near 137 degrees east longitude and 4.5 degrees south latitude. The map shows water ice clouds at equatorial latitudes that are typical for late southern winter, when Mars is farther from the sun. Along the southern (bottom) part of the map there are patches of orange clouds, indicating dust lofted into the atmosphere. Small, short-lived dust storms are common at this time of year on Mars and were taken into account when Curiosity's landing system was designed and tested. Larger and more long-lived dust storms are very rare at this time of year.


This global map of Mars was acquired on October 28, 2008, by the Mars Color Imager instrument on NASA's Mars Reconnaissance Orbiter. It was acquired during the same season that NASA's Curiosity rover will land in, but two Mars years earlier. It is remarkably free of water ice clouds when compared with the maps acquired this year in the days leading up to Curiosity's landing.

In 2008, during this season, the planet was dustier than usual. Larger amounts of dust cause sunlight to warm the atmosphere and make it less dense, which means less stopping power for a landing rover. What's more, dusty conditions can lead to an increased chance for small, intense dust storms, another challenge for rover landings. So far, the weather forecast for Curiosity calls for a clearer atmosphere; nonetheless, the spacecraft has been designed to land safely under conditions similar to those observed in 2008.

The map is a rectangular projection of Mars (from 90 degrees latitude to minus 90 degrees latitude, and minus 180 degrees longitude to 180 degrees east longitude). The landing site is located on the right side of the map, near 137 degrees east longitude and 4.5 degrees south latitude. Along the northern (top) and southern (bottom) parts of the map there are patches of orange clouds, indicating dust lofted into the atmosphere.

Map credit 1: NASA/JPL-Caltech/MSSS; map credit 2: NASA/JPL-Caltech/MSSS

Note: NASA has released an additional Martian weather map, that of August 5th, the day Curiosity landed in Gale Crater.

Sunday, August 5, 2012

NGC 1187


This picture taken with ESO’s Very Large Telescope shows the galaxy NGC 1187. This impressive spiral lies about 60 million light-years away in the constellation of Eridanus (The River). NGC 1187 has hosted two supernova explosions during the last thirty years, the latest one in 2007.

Photo credit: ESO

Note: For more information, see A Blue Whirlpool in The River.

Saturday, August 4, 2012

Dunes on the Move in Lyot Crater


HiRISE has been carrying out a dedicated survey of sand dunes on Mars, determining whether and how fast the dunes move by observing repeatedly at intervals of Martian years. More than 60 sites have been monitored so far, showing that sand dunes from the equator to the poles are advancing at rates of up to 1 meter per Martian year.

These observations are still spotty, however, and tend to be concentrated in the tropics and the North Polar erg (the sand sea that surrounds the North Pole). One latitude band that had not been sampled at all lies between 30 and 65 degrees north. This observation is among a set of images acquired to fill that gap.

This image shows a variety of different dune types in southern Lyot Crater in the northern lowlands at 48.9 degrees North. Transverse dunes to the west grade into longitudinal dunes downwind to the east and barchans to the south, possibly because of local winds channeled by topography in the impact basin. This image was intended to match the approximate illumination and viewing conditions of an earlier HiRISE observation that was made two Martian years earlier, in August 2008.

Detailed comparison of the two images shows movement on many of the dunes during this interval of nearly four Earth years. The subimage is an animation showing changes on one of the small barchans in the south of the dune field. The area pictured in the subimage is about 100 meters across. Winds from the west (left) have shifted the small ripples up the back of the dune towards the east. Sand has blown over the crest of the dune, cascaded down the steep slip face, and accumulated along the base of the slip face in the lee of the dune. In this way, the small dune advances slowly downwind.

Other images also show dune activity in this latitude band, adding to a growing suspicion that dunes are on the move everywhere on Mars, faster in some places than others.

Photo credit: NASA/JPL/University of Arizona

Friday, August 3, 2012

The Morphology of a Coronal Mass Ejection


This illustration shows the morphology of a Coronal Mass Ejection (CME) – a gigantic eruption that releases enormous amounts of matter and energy from the Sun through the corona and into space – as revealed by radio-sounding experiments.

Radio sounding of the solar corona is a technique that exploits radio transmissions from planetary missions to probe the corona of the Sun. This technique can be performed when a spacecraft is located at superior solar conjunction – meaning that Earth, Sun and the spacecraft lie on the same line, with the spacecraft located on the opposite side of the Sun with respect to our planet. In this configuration, or more precisely just before and after it, radio signals sent out by the spacecraft pass through the solar corona – the hot outer atmosphere of the Sun, which consists of turbulent plasma at temperatures of millions of degrees – as they travel towards Earth. Electrons in the coronal plasma interact with the radio signals, causing a frequency shift that can be measured on Earth and analyzed to infer the electron density in the corona.

The upper part of the illustration shows the limb of the Sun (on the right), a CME moving away from the Sun (in the center) and the path traveled by radio waves sent out by a spacecraft on their way to Earth (on the left); all components are shown as viewed from 'above', perpendicularly to the ecliptic plane. The lower part of the illustration shows a graph depicting how the density of electrons varies in time as a CME moves across the path of a radio signal that is traveling from the spacecraft to Earth.

Based on data collected during four CMEs in 2004 using ESA's Mars Express spacecraft, scientists have been able to probe the morphology of a CME in great detail. According to the data, when the path of the radio signal is traversed by a CME, the electron density first undergoes a gentle rise, followed by a steeper increase and, eventually, by a smooth decline, as shown in the graph. This suggests that the proper, dense structure of a CME is preceded by a shock front and a series of smaller fronts that consist of less dense material. The smaller fronts build up as the CME itself propagates outward through the corona, pushing material ahead of it and piling it up in a similar way to a bulldozer. In contrast, material immediately behind the CME has extremely low density, as indicated by the eventual density decrease. These results have been presented by Pätzold et al., 2012.

Illustration credit: ESA/AOES Medialab

Note: For more information, see Planetary Missions Probe Giant Eruptions in the Sun's Corona.

Thursday, August 2, 2012

SN 1957D in M83: X-Rays Discovered from Young Supernova Remnant


Over fifty years ago, a supernova was discovered in M83, a spiral galaxy about 15 million light years from Earth. Astronomers have used NASA's Chandra X-ray Observatory to make the first detection of X-rays emitted by the debris from this explosion.

Named SN 1957D because it was the fourth supernova to be discovered in the year of 1957, it is one of only a few located outside of the Milky Way galaxy that is detectable, in both radio and optical wavelengths, decades after its explosion was observed. In 1981, astronomers saw the remnant of the exploded star in radio waves, and then in 1987 they detected the remnant at optical wavelengths, years after the light from the explosion itself became undetectable.

A relatively short observation -- about 14 hours long -- from NASA's Chandra X-ray Observatory in 2000 and 2001 did not detect any X-rays from the remnant of SN 1957D. However, a much longer observation obtained in 2010 and 2011, totaling nearly 8 and 1/2 days of Chandra time, did reveal the presence of X-ray emission. The X-ray brightness in 2000 and 2001 was about the same as or lower than in this deep image.

This new Chandra image of M83 is one of the deepest X-ray observations ever made of a spiral galaxy beyond our own. This full-field view of the spiral galaxy shows the low, medium, and high-energy X-rays observed by Chandra in red, green, and blue respectively. The location of SN 1957D, which is found on the inner edge of the spiral arm just above the galaxy's center, is outlined in the box (or can be seen by mousing over the image.)

The new X-ray data from the remnant of SN 1957D provide important information about the nature of this explosion that astronomers think happened when a massive star ran out of fuel and collapsed. The distribution of X-rays with energy suggests that SN 1957D contains a neutron star, a rapidly spinning, dense star formed when the core of pre-supernova star collapsed. This neutron star, or pulsar, may be producing a cocoon of charged particles moving at close to the speed of light known as a pulsar wind nebula.

If this interpretation is confirmed, the pulsar in SN 1957D is observed at an age of 55 years, one of the youngest pulsars ever seen. The remnant of SN 1979C in the galaxy M100 contains another candidate for the youngest pulsar, but astronomers are still unsure whether there is a black hole or a pulsar at the center of SN 1979C.

An image from the Hubble Space Telescope (in the box labeled "Optical Close-Up") shows that the debris of the explosion that created SN 1957D is located at the edge of a star cluster less than 10 million years old. Many of these stars are estimated to have masses about 17 times that of the Sun. This is just the right mass for a star's evolution to result in a core-collapse supernova as is thought to be the case in SN 1957D.

Photo credit: X-ray: NASA/CXC/STScI/K.Long et al., Optical: NASA/STScI

Wednesday, August 1, 2012

Messier 68


Messier 68 is located about 33,000 light-years from Earth in the constellation Hydra (The Female Water Snake). French astronomer Charles Messier notched the object as the 68th entry in his famous catalog in 1780.

The image was taken by Hubble’s Wide Field Camera of the Advanced Camera for Surveys and combines visible and infrared light. It has a field of view of about 3.4 by 3.4 arcminutes.

Photo credit: ESA/Hubble & NASA