Pages

Showing posts with label Voyager Program. Show all posts

Wednesday, August 27, 2014

Neptune


During August 16 and 17, 1989, the Voyager 2 narrow-angle camera was used to photograph Neptune almost continuously, recording approximately two and one-half rotations of the planet. These images represent the most complete set of full disk Neptune images that the spacecraft will acquire. This picture from the sequence shows two of the four cloud features which have been tracked by the Voyager cameras during the past two months. The large dark oval near the western limb (the left edge) is at a latitude of 22 degrees south and circuits Neptune every 18.3 hours. The bright clouds immediately to the south and east of this oval are seen to substantially change their appearances in periods as short as four hours. The second dark spot, at 54 degrees south latitude near the terminator (lower right edge), circuits Neptune every 16.1 hours. This image has been processed to enhance the visibility of small features, at some sacrifice of color fidelity.

Image credit: NASA/JPL

Note: For more information, see NASA Pluto-Bound Spacecraft Crosses Neptune's Orbit, 25 Years After Neptune: Reflections on Voyager, and New Horizons Crosses the Orbit of Neptune.

Sunday, August 24, 2014

Voyager 2 Flyby of Triton


NASA's Voyager 2 spacecraft gave humanity its first glimpse of Neptune and its moon Triton in the summer of 1989. Like an old film, Voyager's historic footage of Triton has been "restored" and used to construct the best-ever global color map of that strange moon (See PIA18668). The map, produced by Dr. Paul Schenk, a scientist at the Lunar and Planetary Institute in Houston, has also been used to make this movie recreating that historic Voyager encounter, which took place 25 years ago, on August 25, 1989.

Video credit: NASA/JPL-Caltech/Lunar & Planetary Institute

Note: For more information, see PIA18668: Map of Triton and Voyager Map Details Neptune's Strange Moon Triton.

Monday, August 4, 2014

Voyager 1 Entering Interstellar Space


This artist's concept depicts NASA's Voyager 1 spacecraft entering interstellar space, or the space between stars. Interstellar space is dominated by the plasma, or ionized gas, that was ejected by the death of nearby giant stars millions of years ago. The environment inside our solar bubble is dominated by the plasma exhausted by our sun, known as the solar wind.

The interstellar plasma is shown with an orange glow similar to the color seen in visible-light images from NASA's Hubble Space Telescope that show stars in the Orion nebula traveling through interstellar space.

Illustration credit: NASA/JPL-Caltech

Note: For more information, see NASA Voyager Statement About Solar Wind Models and Sun Sends More 'Tsunami Waves' to Voyager 1.

Friday, May 16, 2014

Jupiter and Its Not-So-Great Red Spot


Jupiter's Great Red Spot is a churning anticyclonic storm. It shows up in images of the giant planet as a conspicuous deep red eye embedded in swirling layers of pale yellow, orange and white. Winds inside this Jovian storm rage at immense speeds, reaching several hundreds of kilometers per hour.

Historic observations as far back as the late 1800s gauged this turbulent spot to span about 41 000 kilometers at its widest point – wide enough to fit three Earths comfortably side by side. In 1979 and 1980 the NASA Voyager fly-bys measured the spot at a shrunken 23,335 kilometers across. Now, Hubble has spied this feature to be smaller than ever before.

This full-disc image of Jupiter was taken on 21 April 2014 with Hubble's Wide Field Camera 3 (WFC3).

Image credit: NASA, ESA, and A. Simon (Goddard Space Flight Center)

Note: For more information, see The Shrinking of Jupiter's Great Red Spot, Jupiter's Great Red Spot is Smaller Than Ever Measured, and Jupiter's Great Red Spot is Shrinking.

Friday, February 14, 2014

Ganymede Geological Map


Animation of a rotating globe of Jupiter's moon Ganymede, with a geologic map superimposed over a global color mosaic. The 37-second animation begins as a global color mosaic image of the moon then quickly fades in the geologic map.

The views incorporate the best available imagery from NASA's Voyager 1 and 2 spacecraft and NASA's Galileo spacecraft.


To present the best information in a single view of Jupiter's moon Ganymede, a global image mosaic was assembled, incorporating the best available imagery from NASA's Voyager 1 and 2 spacecraft and NASA's Galileo spacecraft. This image shows Ganymede centered at 200 west longitude. This mosaic (right) served as the base map for the geologic map of Ganymede (left).

Video credit (top): USGS Astrogeology Science Center/Wheaton/ASU/NASA/JPL-Caltech; image credit (bottom): USGS Astrogeology Science Center/Wheaton/NASA/JPL-Caltech

Note: For more information, see Largest Solar System Moon Detailed in Geologic Map.

Saturday, December 14, 2013

Water Vapor from Europa


This graphic shows the location of water vapor detected over Europa's south pole in observations taken by NASA's Hubble Space Telescope in December 2012. This is the first strong evidence of water plumes erupting off Europa's surface.

Hubble didn't photograph plumes, but spectroscopically detected auroral emissions from oxygen and hydrogen. The aurora is powered by Jupiter's magnetic field. This is only the second moon in the solar system found ejecting water vapor from the frigid surface. The image of Europa is derived from a global surface map generated from combined observations taken by NASA's Voyager and Galileo space probes.

Image credit: NASA/ESA/L. Roth/SWRI/University of Cologne

Note: For more information, see Hubble Discovers Water Vapor Venting from Jupiter's Moon Europa, PIA17659: Artist's Concept of Europa Water Vapor Plume, and Hubble Sees Evidence of Water Vapor at Jupiter Moon.

Wednesday, November 13, 2013

Saturn, with Earth, Venus and Mars


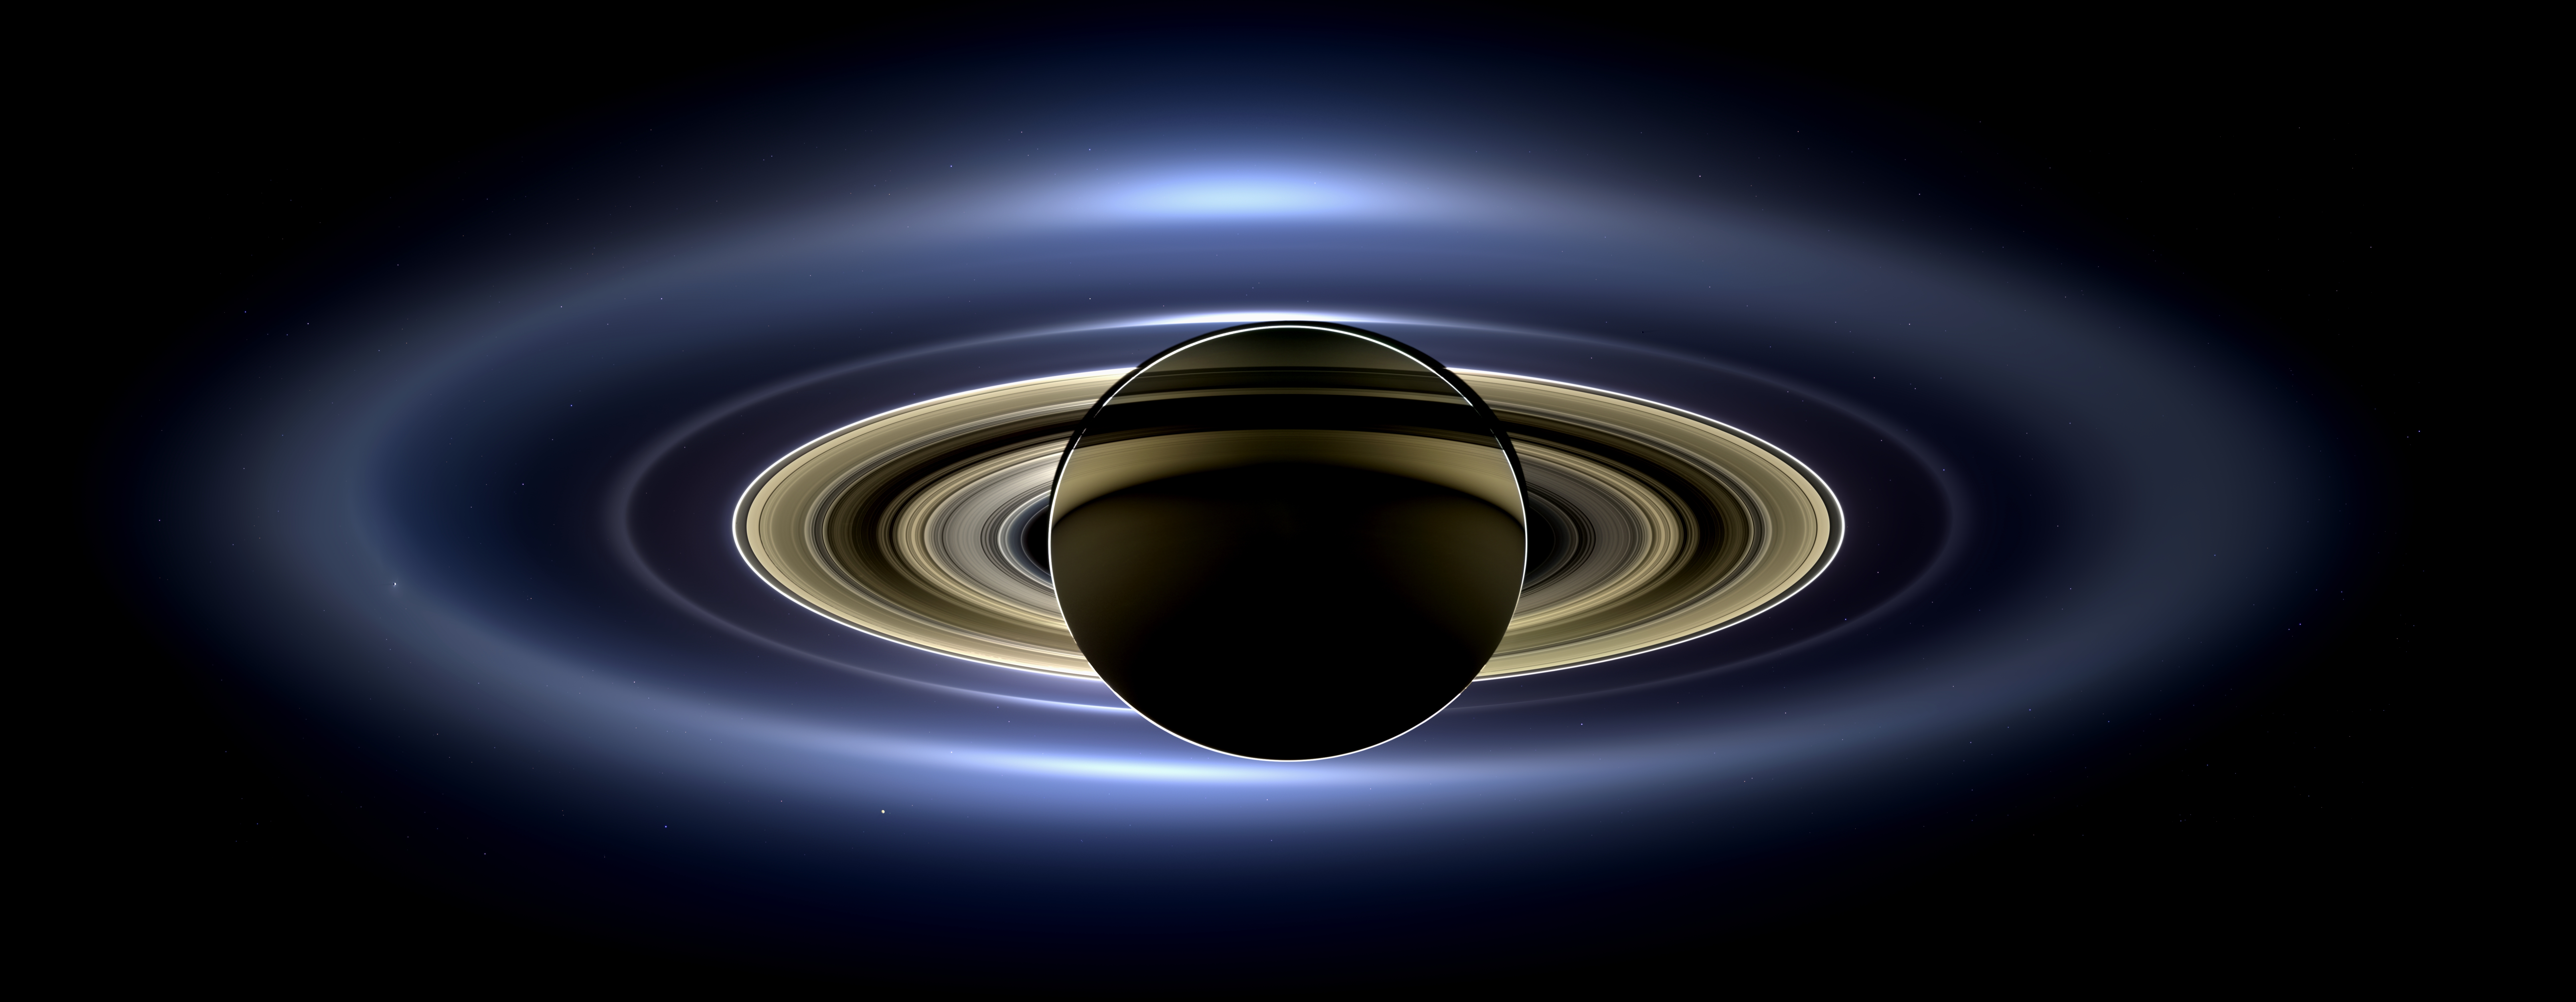
On July 19, 2013, in an event celebrated the world over, NASA's Cassini spacecraft slipped into Saturn's shadow and turned to image the planet, seven of its moons, its inner rings -- and, in the background, our home planet, Earth.

With the sun's powerful and potentially damaging rays eclipsed by Saturn itself, Cassini's onboard cameras were able to take advantage of this unique viewing geometry. They acquired a panoramic mosaic of the Saturn system that allows scientists to see details in the rings and throughout the system as they are backlit by the sun. This mosaic is special as it marks the third time our home planet was imaged from the outer solar system; the second time it was imaged by Cassini from Saturn's orbit; and the first time ever that inhabitants of Earth were made aware in advance that their photo would be taken from such a great distance.

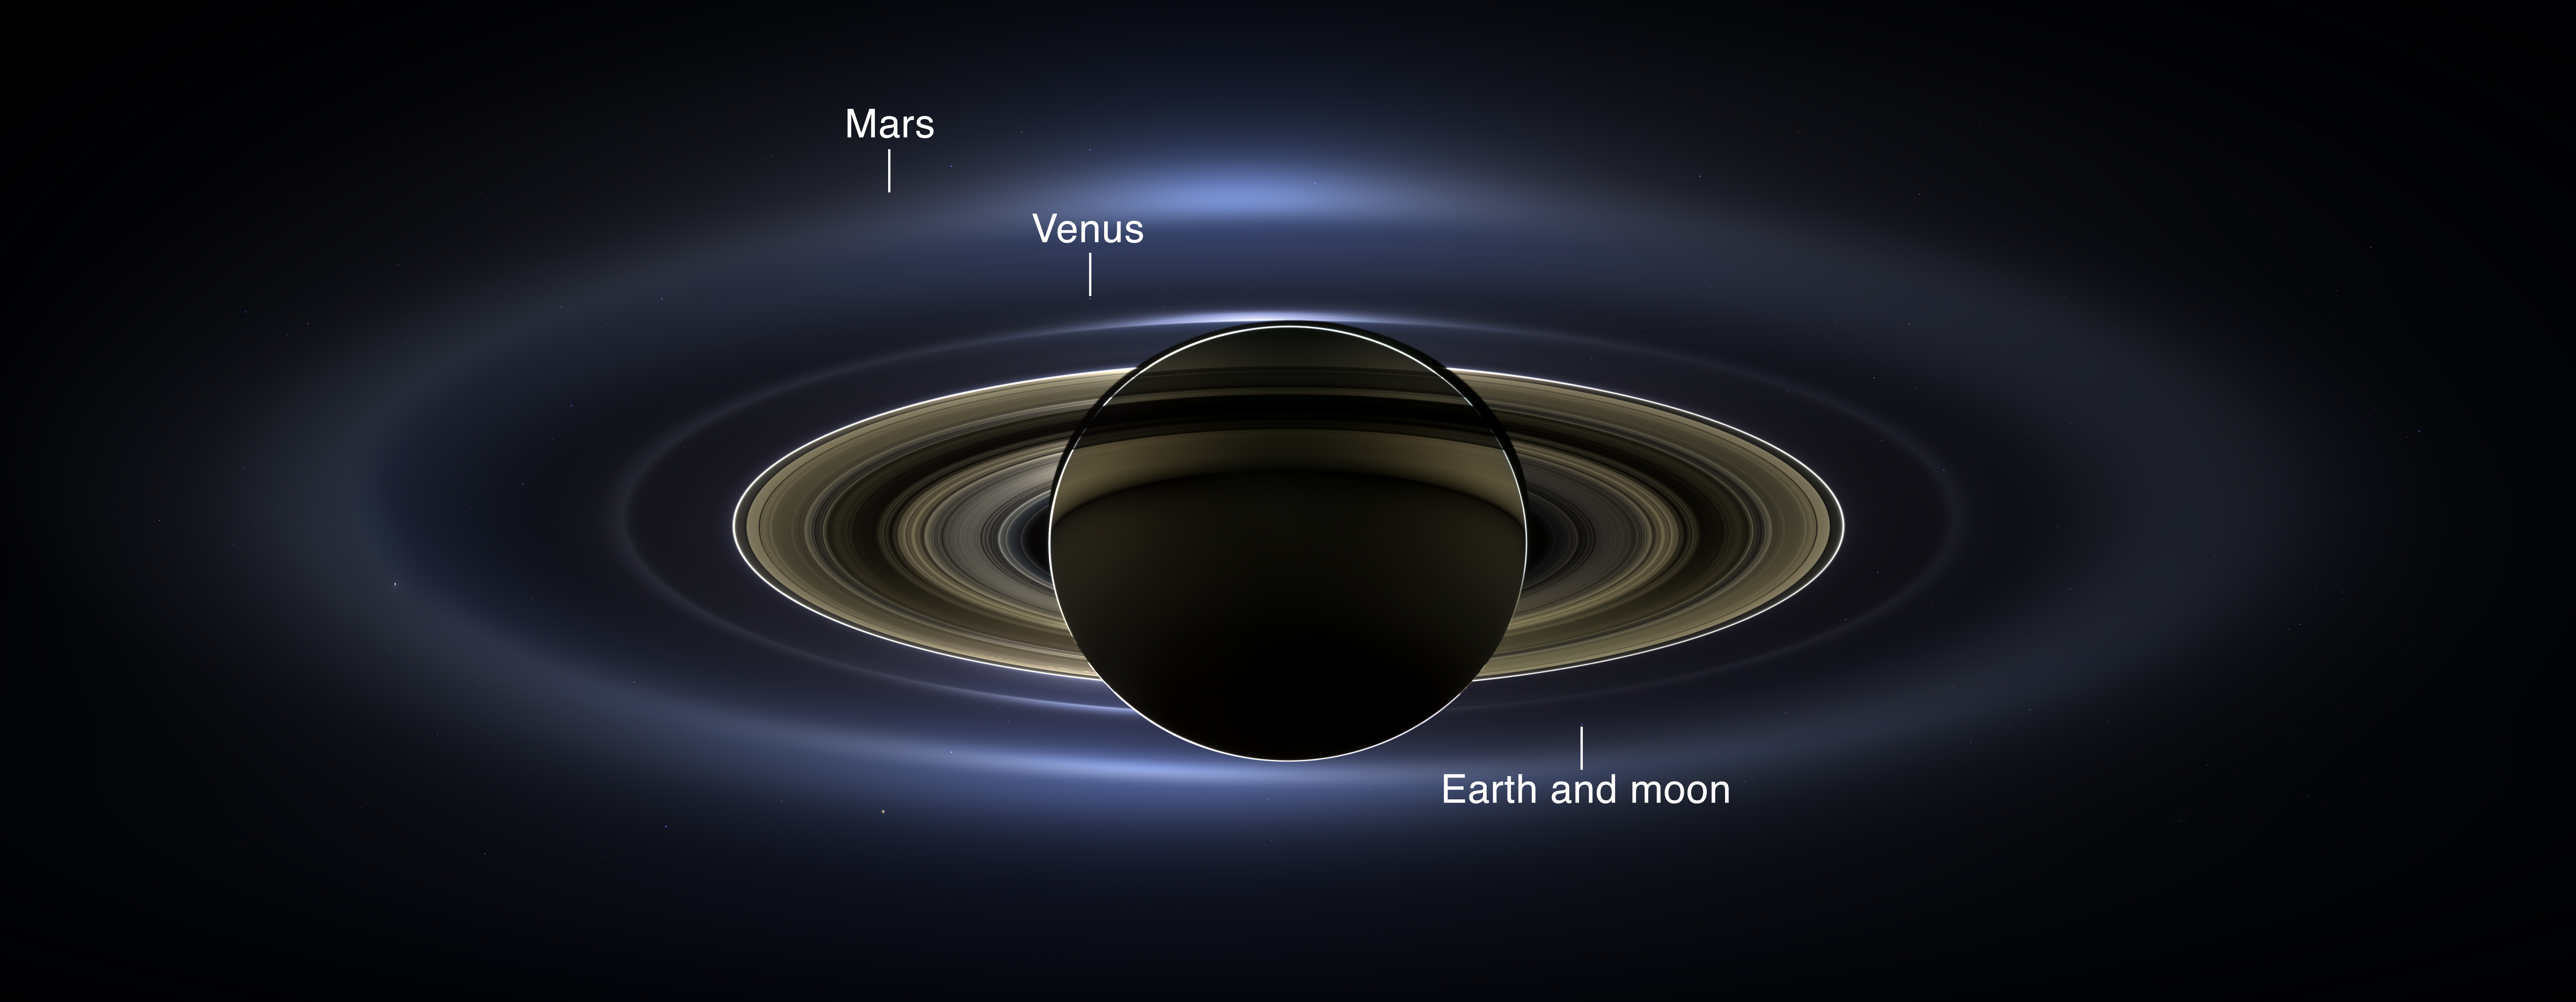
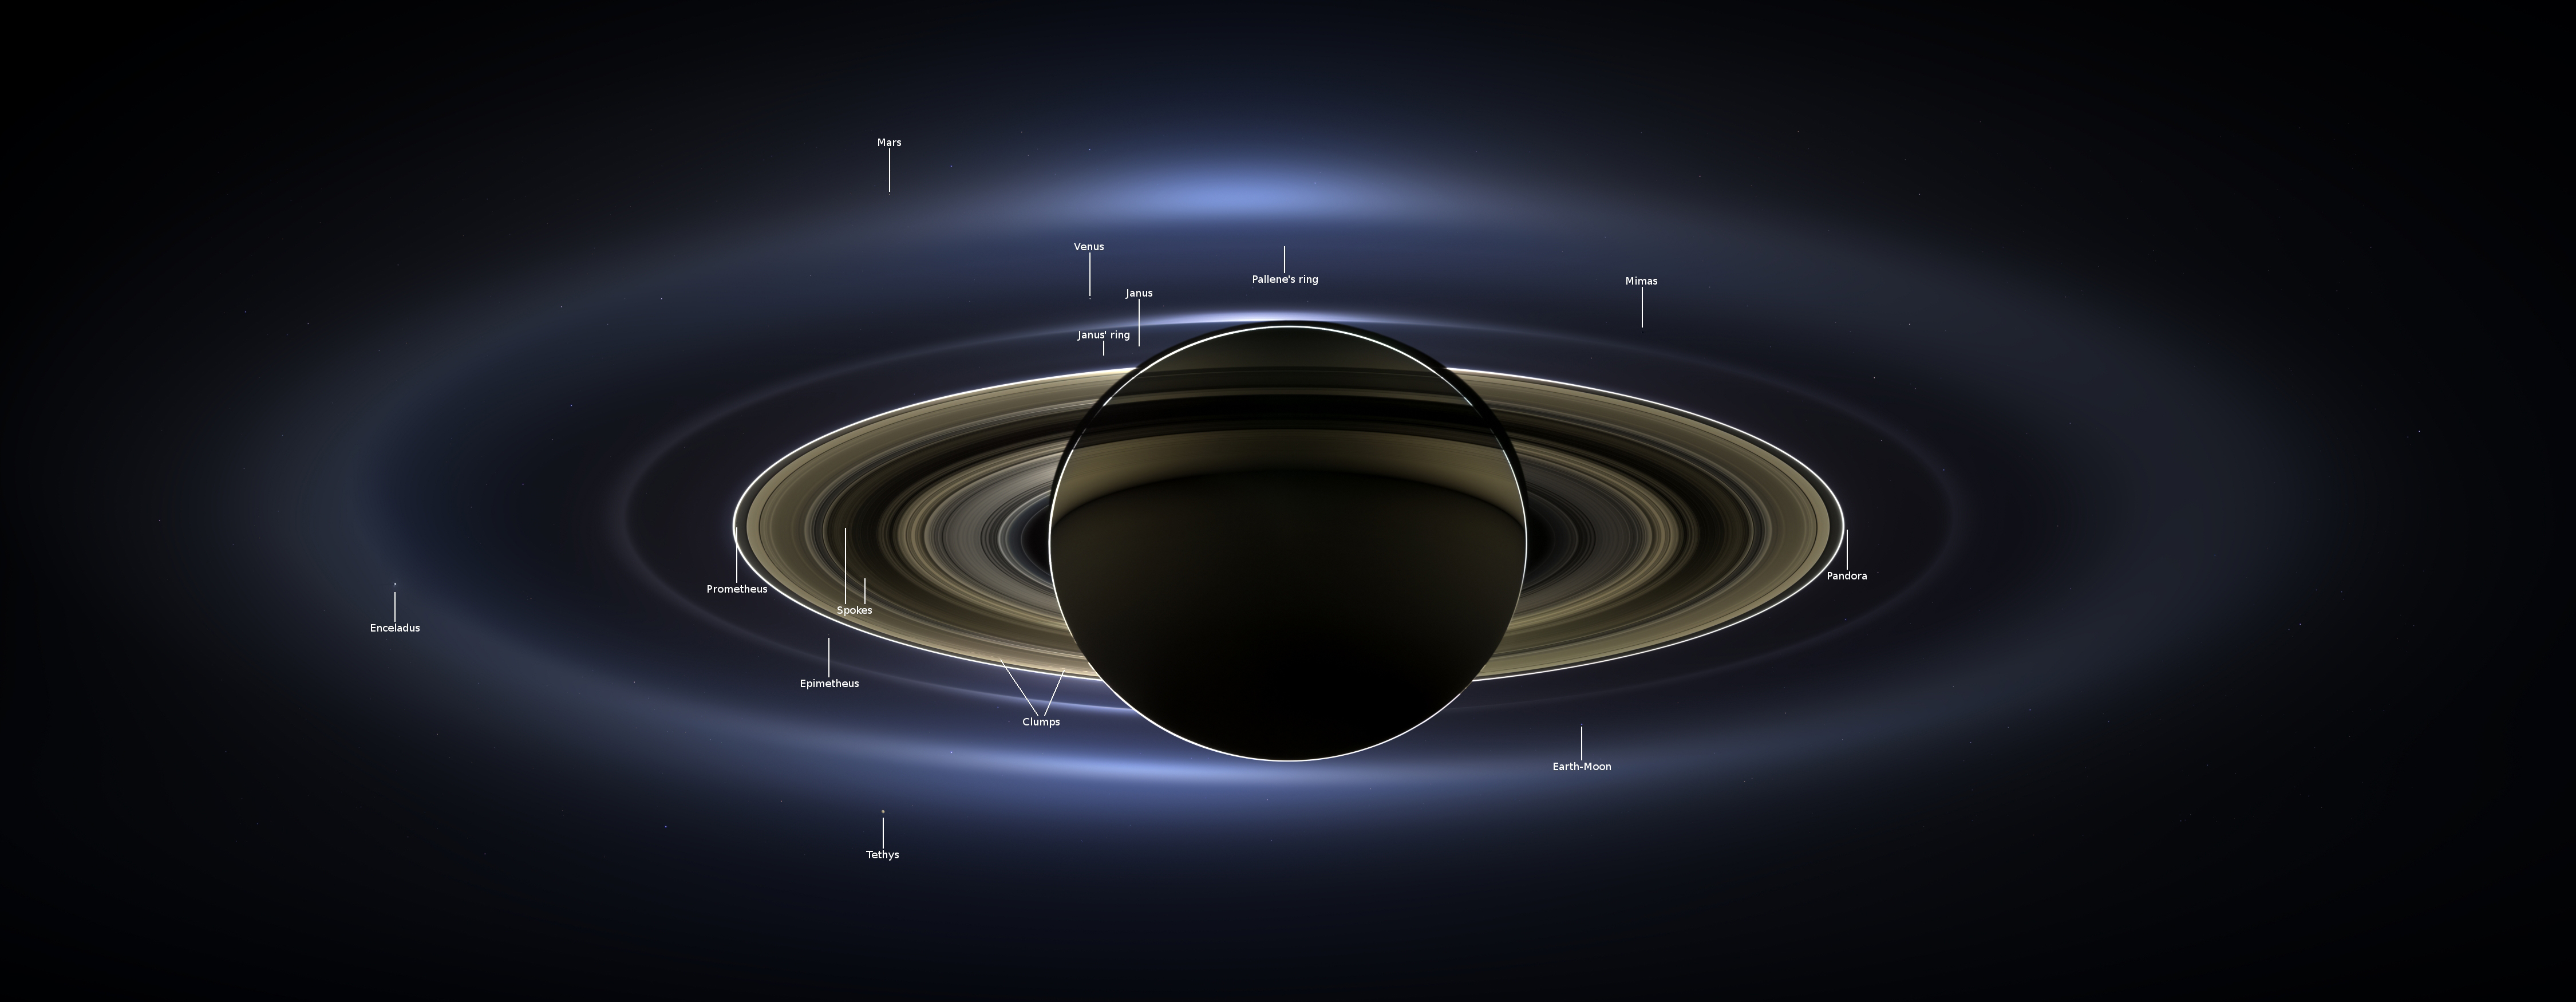
With both Cassini's wide-angle and narrow-angle cameras aimed at Saturn, Cassini was able to capture 323 images in just over four hours. This final mosaic uses 141 of those wide-angle images. Images taken using the red, green and blue spectral filters of the wide-angle camera were combined and mosaicked together to create this natural-color view. A brightened version with contrast and color enhanced (Figure 1), a version with just the planets annotated (Figure 2), and an annotated version (Figure 3) are shown above.

This image spans about 404,880 miles (651,591 kilometers) across.

The outermost ring shown here is Saturn's E ring, the core of which is situated about 149,000 miles (240,000 kilometers) from Saturn. The geysers erupting from the south polar terrain of the moon Enceladus supply the fine icy particles that comprise the E ring; diffraction by sunlight gives the ring its blue color. Enceladus (313 miles, or 504 kilometers, across) and the extended plume formed by its jets are visible, embedded in the E ring on the left side of the mosaic.

At the 12 o'clock position and a bit inward from the E ring lies the barely discernible ring created by the tiny, Cassini-discovered moon, Pallene (3 miles, or 4 kilometers, across). (For more on structures like Pallene's ring, see PIA08328). The next narrow and easily seen ring inward is the G ring. Interior to the G ring, near the 11 o'clock position, one can barely see the more diffuse ring created by the co-orbital moons, Janus (111 miles, or 179 kilometers, across) and Epimetheus (70 miles, or 113 kilometers, across). Farther inward, we see the very bright F ring closely encircling the main rings of Saturn.

Following the outermost E ring counter-clockwise from Enceladus, the moon Tethys (662 miles, or 1,066 kilometers, across) appears as a large yellow orb just outside of the E ring. Tethys is positioned on the illuminated side of Saturn; its icy surface is shining brightly from yellow sunlight reflected by Saturn. Continuing to about the 2 o'clock position is a dark pixel just outside of the G ring; this dark pixel is Saturn's Death Star moon, Mimas (246 miles, or 396 kilometers, across). Mimas appears, upon close inspection, as a very thin crescent because Cassini is looking mostly at its non-illuminated face.

The moons Prometheus, Pandora, Janus and Epimetheus are also visible in the mosaic near Saturn's bright narrow F ring. Prometheus (53 miles, or 86 kilometers, across) is visible as a faint black dot just inside the F ring and at the 9 o'clock position. On the opposite side of the rings, just outside the F ring, Pandora (50 miles, or 81 kilometers, across) can be seen as a bright white dot. Pandora and Prometheus are shepherd moons and gravitational interactions between the ring and the moons keep the F ring narrowly confined. At the 11 o'clock position in between the F ring and the G ring, Janus (111 miles, or 179 kilometers, across) appears as a faint black dot. Janus and Prometheus are dark for the same reason Mimas is mostly dark: we are looking at their non-illuminated sides in this mosaic. Midway between the F ring and the G ring, at about the 8 o'clock position, is a single bright pixel, Epimetheus. Looking more closely at Enceladus, Mimas and Tethys, especially in the brightened version of the mosaic, one can see these moons casting shadows through the E ring like a telephone pole might cast a shadow through a fog.

In the non-brightened version of the mosaic, one can see bright clumps of ring material orbiting within the Encke gap near the outer edge of the main rings and immediately to the lower left of the globe of Saturn. Also, in the dark B ring within the main rings, at the 9 o'clock position, one can see the faint outlines of two spoke features, first sighted by NASA's Voyager spacecraft in the early 1980s and extensively studied by Cassini.

Finally, in the lower right of the mosaic, in between the bright blue E ring and the faint but defined G ring, is the pale blue dot of our planet, Earth. Look closely and you can see the moon protruding from the Earth's lower right. (For a higher resolution view of the Earth and moon taken during this campaign, see PIA14949.) Earth's twin, Venus, appears as a bright white dot in the upper left quadrant of the mosaic, also between the G and E rings. Mars also appears as a faint red dot embedded in the outer edge of the E ring, above and to the left of Venus.

For ease of visibility, Earth, Venus, Mars, Enceladus, Epimetheus and Pandora were all brightened by a factor of eight and a half relative to Saturn. Tethys was brightened by a factor of four. In total, 809 background stars are visible and were brightened by a factor ranging from six, for the brightest stars, to 16, for the faintest. The faint outer rings (from the G ring to the E ring) were also brightened relative to the already bright main rings by factors ranging from two to eight, with the lower-phase-angle (and therefore fainter) regions of these rings brightened the most. The brightened version of the mosaic was further brightened and contrast-enhanced all over to accommodate print applications and a wide range of computer-screen viewing conditions.

Some ring features -- such as full rings traced out by tiny moons -- do not appear in this version of the mosaic because they require extreme computer enhancement, which would adversely affect the rest of the mosaic. This version was processed for balance and beauty.

This view looks toward the unlit side of the rings from about 17 degrees below the ring plane. Cassini was approximately 746,000 miles (1.2 million kilometers) from Saturn when the images in this mosaic were taken. Image scale on Saturn is about 45 miles (72 kilometers) per pixel.

This mosaic was made from pictures taken over a span of more than four hours while the planets, moons and stars were all moving relative to Cassini. Thus, due to spacecraft motion, these objects in the locations shown here were not in these specific places over the entire duration of the imaging campaign. Note also that Venus appears far from Earth, as does Mars, because they were on the opposite side of the sun from Earth.

Image credit: NASA/JPL-Caltech/SSI

Note: For more information, see NASA Cassini Spacecraft Provides New View of Saturn and Earth, PIA17679: The Faces of 'Wave at Saturn' and Spectacular New View of Saturn and Earth. From earlier in the year, see Cassini to Photograph Earth From Deep Space and Cassini Releases Image of Earth Waving at Saturn.

Sunday, September 15, 2013

Voyager Goes Interstellar


This artist's concept puts solar system distances in perspective. The scale bar is in astronomical units, with each set distance beyond 1 AU representing 10 times the previous distance. One AU is the distance from the sun to the Earth, which is about 93 million miles or 150 million kilometers. Neptune, the most distant planet from the sun, is about 30 AU.

Informally, the term "solar system" is often used to mean the space out to the last planet. Scientific consensus, however, says the solar system goes out to the Oort Cloud, the source of the comets that swing by our sun on long time scales. Beyond the outer edge of the Oort Cloud, the gravity of other stars begins to dominate that of the sun.

The inner edge of the main part of the Oort Cloud could be as close as 1,000 AU from our sun. The outer edge is estimated to be around 100,000 AU.

NASA's Voyager 1, humankind's most distant spacecraft, is around 125 AU. Scientists believe it entered interstellar space, or the space between stars, on August 25, 2012. Much of interstellar space is actually inside our solar system. It will take about 300 years for Voyager 1 to reach the inner edge of the Oort Cloud and possibly about 30,000 years to fly beyond it.

Alpha Centauri is currently the closest star to our solar system. But, in 40,000 years, Voyager 1 will be closer to the star AC +79 3888 than to our own sun. AC +79 3888 is actually traveling faster toward Voyager 1 than the spacecraft is traveling toward it.

Illustration credit: NASA/JPL-Caltech

Note: Of course, this story is major news, and many articles and graphics have been published. The following is some of those available:
* PIA17045: Voyager Captures Sounds of Interstellar Space
* PIA17047: Voyager Signal Spotted By Earth Radio Telescopes
* PIA17048: One Voyager Out, One Voyager In (Artist Concept)
* PIA17049: Voyager in Space (Artist Concept)
* PIA17441: Observed Change in Density Shows Voyager is in Interstellar Space
* PIA17442: Mystery of the Interstellar Magnetic Field (Artist's Concept)
* PIA17460: Moving into Interstellar Space (Artist Concept)
* PIA17461: Heading toward Gliese 445
* PIA17462: Voyager 1 Entering Interstellar Space (Artist Concept)
* PIA17463: Heliosphere Traveling Through Interstellar Space
* PIA17464: Voyager 1 Launch (1977)
* How Do We Know When Voyager Reaches Interstellar Space?
* NASA Spacecraft Embarks on Historic Journey Into Interstellar Space
* Voyager 1 Reaches Interstellar Space

From earlier in the year, see:
* NASA's Voyager 1 Explores Final Frontier of Our 'Solar Bubble'
* Voyager 1 Approaches Interstellar Space

Saturday, August 10, 2013

The Sun's Magnetic Field is About to Flip


Something big is about to happen on the sun. According to measurements from NASA-supported observatories, the sun's vast magnetic field is about to flip.

"It looks like we're no more than 3 to 4 months away from a complete field reversal," says solar physicist Todd Hoeksema of Stanford University. "This change will have ripple effects throughout the solar system."

The sun's magnetic field changes polarity approximately every 11 years. It happens at the peak of each solar cycle as the sun's inner magnetic dynamo re-organizes itself. The coming reversal will mark the midpoint of Solar Cycle 24. Half of 'Solar Max' will be behind us, with half yet to come.

Hoeksema is the director of Stanford's Wilcox Solar Observatory, one of the few observatories in the world that monitor the sun's polar magnetic fields. The poles are a herald of change. Just as Earth scientists watch our planet's polar regions for signs of climate change, solar physicists do the same thing for the sun. Magnetograms at Wilcox have been tracking the sun's polar magnetism since 1976, and they have recorded three grand reversals—with a fourth in the offing.

Solar physicist Phil Scherrer, also at Stanford, describes what happens: "The sun's polar magnetic fields weaken, go to zero, and then emerge again with the opposite polarity. This is a regular part of the solar cycle."

A reversal of the sun's magnetic field is, literally, a big event. The domain of the sun's magnetic influence (also known as the "heliosphere") extends billions of kilometers beyond Pluto. Changes to the field's polarity ripple all the way out to the Voyager probes, on the doorstep of interstellar space.

When solar physicists talk about solar field reversals, their conversation often centers on the "current sheet." The current sheet is a sprawling surface jutting outward from the sun's equator where the sun's slowly-rotating magnetic field induces an electrical current. The current itself is small, only one ten-billionth of an amp per square meter (0.0000000001 amps/m2), but there’s a lot of it: the amperage flows through a region 10,000 km thick and billions of kilometers wide. Electrically speaking, the entire heliosphere is organized around this enormous sheet.

During field reversals, the current sheet becomes very wavy. Scherrer likens the undulations to the seams on a baseball. As Earth orbits the sun, we dip in and out of the current sheet. Transitions from one side to another can stir up stormy space weather around our planet.

Cosmic rays are also affected. These are high-energy particles accelerated to nearly light speed by supernova explosions and other violent events in the galaxy. Cosmic rays are a danger to astronauts and space probes, and some researchers say they might affect the cloudiness and climate of Earth. The current sheet acts as a barrier to cosmic rays, deflecting them as they attempt to penetrate the inner solar system. A wavy, crinkly sheet acts as a better shield against these energetic particles from deep space.

As the field reversal approaches, data from Wilcox show that the sun's two hemispheres are out of synch.

"The sun's north pole has already changed sign, while the south pole is racing to catch up," says Scherrer. "Soon, however, both poles will be reversed, and the second half of Solar Max will be underway."

When that happens, Hoeksema and Scherrer will share the news with their colleagues and the public.

Video credit: NASA

Tuesday, July 16, 2013

Neptune's New Moon, S/2004 N1


NASA's Hubble Space Telescope has discovered a new moon orbiting the distant blue-green planet Neptune, the 14th known to be circling the giant planet.

The moon, designated S/2004 N 1, is estimated to be no more than 12 miles across, making it the smallest known moon in the Neptunian system. It is so small and dim that it is roughly 100 million times fainter than the faintest star that can be seen with the naked eye. It even escaped detection by NASA's Voyager 2 spacecraft, which flew past Neptune in 1989 and surveyed the planet's system of moons and rings.

Mark Showalter of the SETI Institute in Mountain View, California, found the moon July 1, while studying the faint arcs, or segments of rings, around Neptune. "The moons and arcs orbit very quickly, so we had to devise a way to follow their motion in order to bring out the details of the system," he said. "It's the same reason a sports photographer tracks a running athlete -- the athlete stays in focus, but the background blurs."

The method involved tracking the movement of a white dot that appears over and over again in more than 150 archival Neptune photographs taken by Hubble from 2004 to 2009.

On a whim, Showalter looked far beyond the ring segments and noticed the white dot about 65,400 miles from Neptune, located between the orbits of the Neptunian moons Larissa and Proteus. The dot is S/2004 N 1. Showalter plotted a circular orbit for the moon, which completes one revolution around Neptune every 23 hours.

For images, video, and more information Neptune's new moon, visit: http://hubblesite.org/news/2013/30

Image credit: NASA, ESA, M. Showalter/SETI Institute

Thursday, March 21, 2013

NASA Voyager Status Update on Voyager 1 Location


"The Voyager team is aware of reports today that NASA's Voyager 1 has left the solar system," said Edward Stone, Voyager project scientist based at the California Institute of Technology, Pasadena, California. "It is the consensus of the Voyager science team that Voyager 1 has not yet left the solar system or reached interstellar space. In December 2012, the Voyager science team reported that Voyager 1 is within a new region called 'the magnetic highway' where energetic particles changed dramatically. A change in the direction of the magnetic field is the last critical indicator of reaching interstellar space and that change of direction has not yet been observed."

Image credit: NASA/JPL-Caltech

Wednesday, February 20, 2013

Voyager 1 in the Depletion Region


This artist's concept shows NASA's Voyager 1 spacecraft in a new region at the edge of our solar system where the magnetic field lines generated by our sun are piling up and intensifying. Voyager 1 is in an area scientists are calling the depletion region where the magnetic field acts as a kind of "magnetic highway." In this region, energetic ions from inside the heliosphere, the magnetic bubble that the sun blows around itself, escape out, and energetic ions from interstellar space zoom in. (To learn more about how this region acts as a magnetic highway, see PIA16486.) The depletion region is the outermost known layer of the heliosphere.

Magnetic field lines form a spiral around the solar system because of the rotation of the sun (see PIA15179), and at the edge of the solar system they form roughly parallel lines. At the end of 2004, Voyager 1 passed the termination shock, where the solar wind abruptly slowed down and compressed, and the intensity of the magnetic field tripled as the distance between magnetic field lines decreased by one-third. By mid-2010, Voyager entered a stagnation region where the wind slowed almost to a stop and the magnetic field intensity increased twice again as the magnetic field lines were pressed closer together. In August 2012, Voyager 1 entered the outermost known layer where the depletion of energetic ions allowed the field lines to compress even closer together. Scientists believe the field lines are piling up because an interstellar wind outside is pushing back.

Illustration credit: NASA/JPL-Caltech

Sunday, August 12, 2012

Signs Changing Fast for Voyager at Solar System Edge


Two of three key signs of changes expected to occur at the boundary of interstellar space have changed faster than at any other time in the last seven years, according to new data from NASA's Voyager 1 spacecraft.

For the last seven years, Voyager 1 has been exploring the outer layer of the bubble of charged particles the sun blows around itself. In one day, on July 28, data from Voyager 1's cosmic ray instrument showed the level of high-energy cosmic rays originating from outside our solar system jumped by five percent. During the last half of that same day, the level of lower-energy particles originating from inside our solar system dropped by half. However, in three days, the levels had recovered to near their previous levels.

A third key sign is the direction of the magnetic field, and scientists are eagerly analyzing the data to see whether that has, indeed, changed direction. Scientists expect that all three of these signs will have changed when Voyager 1 has crossed into interstellar space. A preliminary analysis of the latest magnetic field data is expected to be available in the next month.

"These are thrilling times for the Voyager team as we try to understand the quickening pace of changes as Voyager 1 approaches the edge of interstellar space," said Edward Stone, the Voyager project scientist based at the California Institute of Technology, Pasadena, California. "We are certainly in a new region at the edge of the solar system where things are changing rapidly. But we are not yet able to say that Voyager 1 has entered interstellar space."

The levels of high-energy cosmic ray particles have been increasing for years, but more slowly than they are now. The last jump -- of five percent -- took one week in May. The levels of lower-energy particles from inside our solar system have been slowly decreasing for the last two years. Scientists expect that the lower-energy particles will drop close to zero when Voyager 1 finally crosses into interstellar space.

"The increase and the decrease are sharper than we've seen before, but that's also what we said about the May data," Stone said. "The data are changing in ways that we didn't expect, but Voyager has always surprised us with new discoveries."

Voyager 1, which launched on September 5, 1977, is 11 billion miles (18 billion kilometers) from the sun. Voyager 2, which launched on August 20, 1977, is close behind, at 9.3 billion miles (15 billion kilometers) from the sun.

"Our two veteran Voyager spacecraft are hale and healthy as they near the 35th anniversary of their launch," said Suzanne Dodd, Voyager project manager based at NASA's Jet Propulsion Laboratory, Pasadena. "We know they will cross into interstellar space. It's just a question of when."

Illustration credit: NASA/JPL-Caltech

Note: This story was actually released by JPL on August 3rd, but had to be pushed back due to other stories, especially those related to Curiosity.

Saturday, July 21, 2012

The "Pioneer Anomaly" Solved


The unexpected slowing of NASA's Pioneer 10 and 11 spacecraft - the so-called "Pioneer Anomaly" - turns out to be due to the slight, but detectable effect of heat pushing back on the spacecraft, according to a recent paper. The heat emanates from electrical current flowing through instruments and the thermoelectric power supply. The results were published on June 12 in the journal Physical Review Letters.

"The effect is something like when you're driving a car and the photons from your headlights are pushing you backward," said Slava Turyshev, the paper's lead author at NASA's Jet Propulsion Laboratory, Pasadena, California. "It is very subtle."

Launched in 1972 and 1973 respectively, Pioneer 10 and 11 are on an outward trajectory from our sun. In the early 1980s, navigators saw a deceleration on the two spacecraft, in the direction back toward the sun, as the spacecraft were approaching Saturn. They dismissed it as the effect of dribbles of leftover propellant still in the fuel lines after controllers had cut off the propellant. But by 1998, as the spacecraft kept traveling on their journey and were over 8 billion miles (13 billion kilometers) away from the sun, a group of scientists led by John Anderson of JPL realized there was an actual deceleration of about 300 inches per day squared (0.9 nanometers per second squared). They raised the possibility that this could be some new type of physics that contradicted Einstein's general theory of relativity.

In 2004, Turyshev decided to start gathering records stored all over the country and analyze the data to see if he could definitively figure out the source of the deceleration. In part, he and colleagues were contemplating a deep space physics mission to investigate the anomaly, and he wanted to be sure there was one before asking NASA for a spacecraft.

He and colleagues went searching for Doppler data, the pattern of data communicated back to Earth from the spacecraft, and telemetry data, the housekeeping data sent back from the spacecraft. At the time these two Pioneers were launched, data were still being stored on punch cards. But Turyshev and colleagues were able to copy digitized files from the computer of JPL navigators who have helped steer the Pioneer spacecraft since the 1970s. They also found over a dozen of boxes of magnetic tapes stored under a staircase at JPL and received files from the National Space Science Data Center at NASA Goddard Space Flight Center, Greenbelt, Maryland, and worked with NASA Ames Research Center, Moffett Field, California, to save some of their boxes of magnetic optical tapes. He collected more than 43 gigabytes of data, which may not seem like a lot now, but is quite a lot of data for the 1970s. He also managed to save a vintage tape machine that was about to be discarded, so he could play the magnetic tapes.

The effort was a labor of love for Turyshev and others. The Planetary Society sent out appeals to its members to help fund the data recovery effort. NASA later also provided funding. In the process, a programmer in Canada, Viktor Toth, heard about the effort and contacted Turyshev. He helped Turyshev create a program that could read the telemetry tapes and clean up the old data.

They saw that what was happening to Pioneer wasn't happening to other spacecraft, mostly because of the way the spacecraft were built. For example, the Voyager spacecraft are less sensitive to the effect seen on Pioneer, because its thrusters align it along three axes, whereas the Pioneer spacecraft rely on spinning to stay stable.

With all the data newly available, Turyshev and colleagues were able to calculate the heat put out by the electrical subsystems and the decay of plutonium in the Pioneer power sources, which matched the anomalous acceleration seen on both Pioneers.

"The story is finding its conclusion because it turns out that standard physics prevail," Turyshev said. "While of course it would've been exciting to discover a new kind of physics, we did solve a mystery."

Pioneer 10 and 11 were managed by NASA Ames Research Center, Moffett Field, Calif. Pioneer 10's last signal was received on Earth in January 2003. Pioneer 11's last signal was received in November 1995.

Illustration credit: NASA

Tuesday, June 26, 2012

A Jet Stream on Saturn


A particularly strong jet stream churns through Saturn's northern hemisphere in this false-color view from NASA's Cassini spacecraft.

Clouds associated with the jet stream can be seen in the upper right about a third of the way down from the top of this image. The jet stream clouds appear like a thin, bright orange line here. Moving west and closer to the center of the image, the feature drops south. Farther to the west of this discontinuity, or drop, a blurrier form of the jet stream clouds continues to move along the latitude circle.

See PIA14917 for a closer view and to learn how eddies, or rotating storms, give the jet stream its shape and speed.

The winds of Saturn's jet streams are zonal, meaning they move eastward or westward at particular latitudes. This jet stream is located at about 42 degrees north latitude, and has been visible on Saturn since the days of NASA's Voyager spacecraft (see PIA00027). In the Voyager days, this jet stream had an undulating appearance, leading scientists to dub it the "ribbon wave" (see PIA01378). The planet's atmosphere is always changing, and the jet stream now looks nothing like a ribbon.

Saturn's atmosphere and its rings are shown here in a false color composite made from three images taken in near infrared light through filters that are sensitive to varying degrees of methane absorption. Red and orange colors in this view indicate clouds that are deep in the atmosphere. Yellow and green colors, most noticeable near the top of the view, indicate intermediate clouds. White and blue indicate high clouds and haze.

The white clouds of the equatorial region appear oversaturated because the image was specially processed to bring out the wave.

The rings, in the upper left and lower left of the image, appear bright blue because they are outside of the atmosphere and not affected by methane absorption. This view looks toward the northern, unilluminated side of the rings from about 36 degrees above the ring plane.

The images were taken with the Cassini spacecraft wide-angle camera on January 13, 2008 using a combination of spectral filters sensitive to wavelengths of near-infrared light. The image filtered at 890 nanometers is projected as blue. The image filtered at 728 nanometers is projected as green, and the image filtered at 752 nanometers is projected as red.

The view was acquired at a distance of approximately 810,000 miles (1.3 million kilometers) from Saturn and at a sun-Saturn-spacecraft, or phase, angle of 55 degrees. Image scale is 46 miles (74 kilometers) per pixel.

Photo credit: NASA/JPL-Caltech/Space Science Institute

Note: For more information, see PIA14917: Eddy-Powered Jet Stream; also, Cassini Shows Why Jet Streams Cross-Cut Saturn.

Friday, June 15, 2012

Voyagers in the Heliosheath


This artist's concept shows NASA's two Voyager spacecraft exploring a turbulent region of space known as the heliosheath, the outer shell of the bubble of charged particles around our sun. After more than 33 years of travel, the two Voyager spacecraft will soon reach interstellar space, which is the space between stars.

Our sun gives off a stream of charged particles that form a bubble around our solar system known as the heliosphere. The solar wind travels at supersonic speeds until it crosses a shockwave called the termination shock. That part of our solar system is shown in dark blue. Voyager 1 crossed the termination shock in December 2004 and Voyager 2 did so in August 2007. Beyond the termination shock is the heliosheath, shown in gray, where the solar wind dramatically slows down and heats up. Outside those two areas is territory dominated by the interstellar wind, which is blowing from the left in this image. As the interstellar wind approaches the heliosphere, a bow shock forms, indicated by the bright arc.

Illustration credit: NASA/JPL-Caltech

Note: For more information, see Data From NASA's Voyager 1 Point to Interstellar Future.

Wednesday, April 11, 2012

Mapping the Heliosphere


Data from NASA's Cassini spacecraft have enabled scientists to create this map of the heliosphere, the bubble of charged particles around our Sun.

Charged particles stream out from our Sun in a phenomenon known as solar wind. The solar wind interacts with the matter between stars, which is known as the interstellar medium. The mingling of interstellar medium and solar wind creates particles called energetic neutral atoms, which stream back towards the Sun.

The ion and neutral camera on Cassini's magnetospheric imaging instrument detects energetic neutral atoms. This map shows those in the range of 5,200 to 13,500 electron volts. The regions with the highest intensity of particles are red and those with the lowest intensity of particles are blue.

Cassini detects a different spectrum of energetic neutral atoms than NASA's Interstellar Boundary Explorer (IBEX) does. The IBEX images show lower-energy particles. NASA's Voyager mission collects data on energetic ions in the region that is the source of the energetic neutral atoms.

The area where IBEX found a ribbon of high-intensity particles is outlined in white. The locations of Voyager 1 and Voyager 2 are indicated with the labels "V1" and "V2." The label "nose" indicates the direction that our solar system is traveling through the interstellar medium. The label "tail" indicates the region in the direction opposite the nose.

Image credit: NASA/JPL/JHUAPL

Tuesday, December 20, 2011

Jupiter's Great Red Spot


This Voyager 2 image shows the region of Jupiter extending from the equator to the southern polar latitudes in the neighborhood of the Great Red Spot. A white oval, different from the one observed in a similar position at the time of the Voyager 1 encounter, is situated south of the Great Red Spot. The region of white clouds now extends from east of the red spot and around its northern boundary, preventing small cloud vortices from circling the feature. The disturbed region west of the red spot has also changed since the equivalent Voyager 1 image. It shows more small scale structure and cloud vortices being formed out of the wave structures. The picture was taken on July 3, 1979 from 6 million kilometers (3.72 million miles).

Photo credit: NASA/JPL

Thursday, December 8, 2011

Voyager 1 Reaches the Stagnation Region


NASA's Voyager 1 spacecraft has entered a new region between our solar system and interstellar space, which scientists are calling the stagnation region. In the stagnation region, the wind of charged particles streaming out from our Sun has slowed and turned inward for the first time, our solar system's magnetic field has piled up and higher-energy particles from inside our solar system appear to be leaking out into interstellar space. This image shows that the inner edge of the stagnation region is located about 113 astronomical units (10.5 billion miles or 16.9 billion kilometers) from the Sun. Voyager 1 is currently about 119 astronomical units (11 billion miles or 17.8 billion kilometers) from the Sun. The distance to the outer edge is unknown.

Illustration credit: NASA/JPL-Caltech

Monday, January 3, 2011

Flight over Triton


This simulated voyage over the surface of Neptune's large moon Triton was produced using topographic maps derived from images acquired by NASA's Voyager spacecraft during its August 1989 flyby, 20 years ago.

Triton was the last solid object visited by the Voyager 2 spacecraft on its epic 10-year tour of the outer solar system. Voyager mapped only the hemisphere that faces Neptune, but revealed a very young surface scarred by rising blobs of ice (diapirs), faults, and volcanic pits and lava flows composed of water and other ices. The video begins near the western edge of this hemisphere with an approach over cantaloupe terrain and two large smooth walled plains. The video tracks due east for roughly 1500 kilometers over a large province of volcanic pits, calderas and smooth plains. As can be seen in this video, Triton is locally very rugged (with pits and mounds that are typically a few hundred meters [several hundred feet] high), but has no large mountains or deep basins and regional relief is low. The lack of large topographic features is a consequence of Triton's high internal heat and the low strength of most ices.

The video was produced by using a new topographic map of Triton, combined with a 1.65-kilometer resolution image mosaic. Topographic mapping was based on shape-from-shading analysis of the original Voyager images. Vertical relief has been exaggerated by a factor of 25 to aid interpretation.

Video credit: NASA/JPL/Universities Space Research Association/Lunar & Planetary Institute