Pages

Showing posts with label Magnetic Field. Show all posts

Friday, September 19, 2014

Artist's Conception of WASP-18b


WASP-18: An exoplanet about ten times Jupiter’s mass located some 330 light years from Earth.

The artist's illustration featured in the main part of this graphic depicts a star and its planet, WASP-18b, a giant exoplanet that orbits very close to it. A new study using Chandra data has shown that WASP-18b is making the star that it orbits act much older than it actually is. The lower inset box reveals that no X-rays were detected during a long Chandra observation. This is surprising given the age of the star, suggesting the planet is weakening the star’s magnetic field through tidal forces.

Scale: Inset image is about 5.3 arcmin across (about 0.5 light years).

Image credit: X-ray: NASA/CXC/SAO/I.Pillitteri et al; Optical: DSS; Illustration: NASA/CXC/M.Weiss

Note: For more information, see WASP-18: NASA's Chandra X-ray Observatory Finds Planet That Makes Star Act Deceptively Old.

Friday, September 5, 2014

Magnetar 3XMM J185246.6+003317 Below Supernova Remnant Kesteven 79


Massive stars end their life with a bang, exploding as supernovas and releasing massive amounts of energy and matter. What remains of the star is a small and extremely dense remnant: a neutron star or a black hole.

Neutron stars come in several flavors, depending on properties such as their ages, the strength of the magnetic field concealed beneath their surface, or the presence of other stars nearby. Some of the energetic processes taking place around neutron stars can be explored with X-ray telescopes, like ESA's XMM-Newton.

This image depicts two very different neutron stars that were observed in the same patch of the sky with XMM-Newton. The green and pink bubble dominating the image is Kesteven 79, the remnant of a supernova explosion located about 23,000 light-years away from us.

From the properties of the hot gas in Kesteven 79 and from its size, astronomers estimate that it is between 5000 and 7000 years old. Taking account of the time needed for light to travel to Earth, this means that the supernova that created it must have exploded almost 30,000 years ago. The explosion left behind a young neutron star with a weak magnetic field, which can be seen as the blue spot at the center of Kesteven 79.

Beneath it, a blue splotch indicates an entirely different beast: a neutron star boasting an extremely strong magnetic field, known as a magnetar. Astronomers discovered this magnetar, named 3XMM J185246.6+003317, in 2013 by looking at images that had been taken in 2008 and 2009. After the discovery, they looked at previous images of the same patch of the sky, taken before 2008, but did not find any trace of the magnetar. This suggests that the detection corresponded to an outburst of X-rays released by the magnetar, likely caused by a dramatic change in the structure of its magnetic field.

While the neutron star in the supernova remnant is relatively young, the magnetar is likely a million years old; the age difference means that it is very unlikely that the magnetar arose from the explosion that created Kesteven 79, but must have formed much earlier.

This false-color image is a composite of 15 observations performed between 2004 and 2009 with the EPIC MOS camera on board XMM-Newton. The image combines data collected at energies from 0.3 to 1.2 keV (shown in red), 1.2 to 2 keV (shown in green) and 2 to 7 keV (shown in blue).

Image credit: ESA/XMM-Newton/ Ping Zhou, Nanjing University, China

Wednesday, July 23, 2014

Four Supernova Remnants


In commemoration of the 15th anniversary of NASA's Chandra X-ray Observatory, four newly processed images of supernova remnants dramatically illustrate Chandra's unique ability to explore high-energy processes in the cosmos (see the accompanying press release).

The images of the Tycho and G292.0+1.8 supernova remnants show how Chandra can trace the expanding debris of an exploded star and the associated shock waves that rumble through interstellar space at speeds of millions of miles per hour. The images of the Crab Nebula and 3C58 show how extremely dense, rapidly rotating neutron stars produced when a massive star explodes can create clouds of high-energy particles light years across that glow brightly in X-rays.

Tycho:
More than four centuries after Danish astronomer Tycho Brahe first observed the supernova that bears his name, the supernova remnant it created is now a bright source of X-rays. The supersonic expansion of the exploded star produced a shock wave moving outward into the surrounding interstellar gas, and another, reverse shock wave moving back into the expanding stellar debris. This Chandra image of Tycho reveals the dynamics of the explosion in exquisite detail. The outer shock has produced a rapidly moving shell of extremely high-energy electrons (blue), and the reverse shock has heated the expanding debris to millions of degrees (red and green). There is evidence from the Chandra data that these shock waves may be responsible for some of the cosmic rays - ultra-energetic particles - that pervade the Galaxy and constantly bombard the Earth.

G292.0+1.8:
At a distance of about 20,000 light years, G292.0+1.8 is one of only three supernova remnants in the Milky Way known to contain large amounts of oxygen. These oxygen-rich supernovas are of great interest to astronomers because they are one of the primary sources of the heavy elements (that is, everything other than hydrogen and helium) necessary to form planets and people. The X-ray image from Chandra shows a rapidly expanding, intricately structured, debris field that contains, along with oxygen (yellow and orange), other elements such as magnesium (green) and silicon and sulfur (blue) that were forged in the star before it exploded.

The Crab Nebula:
In 1054 AD, Chinese astronomers and others around the world noticed a new bright object in the sky. This “new star” was, in fact, the supernova explosion that created what is now called the Crab Nebula. At the center of the Crab Nebula is an extremely dense, rapidly rotating neutron star left behind by the explosion. The neutron star, also known as a pulsar, is spewing out a blizzard of high-energy particles, producing the expanding X-ray nebula seen by Chandra. In this new image, lower-energy X-rays from Chandra are red, medium energy X-rays are green, and the highest-energy X-rays are blue.

3C58:
3C58 is the remnant of a supernova observed in the year 1181 AD by Chinese and Japanese astronomers. This new Chandra image shows the center of 3C58, which contains a rapidly spinning neutron star surrounded by a thick ring, or torus, of X-ray emission. The pulsar also has produced jets of X-rays blasting away from it to both the left and right, and extending trillions of miles. These jets are responsible for creating the elaborate web of loops and swirls revealed in the X-ray data. These features, similar to those found in the Crab, are evidence that 3C58 and others like it are capable of generating both swarms of high-energy particles and powerful magnetic fields. In this image, low, medium, and high-energy X-rays detected by Chandra are red, green, and blue respectively.

Image credit: NASA/CXC/SAO

Friday, June 27, 2014

Necklaces of Solar Activity


Back in 1998, the Sun was behaving as expected. The approximately 11-year cycle of activity was proceeding smoothly, heading towards a peak in 2001.

The Solar and Heliospheric Observatory (SOHO) captured this image on 9 November 1998 through its ultraviolet telescope, showing radiation from iron atoms bathed in a gas of around a million degrees Celsius.

This textbook image of solar activity shows two brighter bands circling the Sun at the same latitude in each hemisphere.

At visible wavelengths these bright loops and patches are associated with dark smudges known as sunspots. They are produced when loops of magnetism become buoyant and rise from inside the Sun into the atmosphere.

When the cycle begins, the active regions appear at high latitudes in sparse numbers, disappearing after a few weeks or so. As the cycle proceeds, new and often larger active regions appear more frequently at successively lower latitudes. Many can be larger than Earth, and they sometimes persist for months.

This activity takes place in both hemispheres simultaneously, and about five or six years into the cycle sunspots reach lower latitudes closer to the equator. This is known as solar maximum.

After this, the number of spots begins to decline until they virtually disappear and the cycle starts again at high latitudes. It is one of the enduring mysteries of the Sun why this cycle happens. Certainly, it is linked to the way the Sun generates magnetism deep inside its gaseous layers but the details remain elusive.

In recent years, the Sun has deviated from this textbook behavior. The current cycle was about two years late in starting, the hemispheres are behaving differently and the peak of activity is relatively modest. The next cycle is expected to continue in this new vein. It may even be weaker than the current cycle.

Image credit: SOHO (ESA & NASA)

Monday, June 23, 2014

Earth’s Ever-Changing Magnetic Field


This animation shows changes in Earth’s magnetic field from January to June 2014 as measured by ESA’s Swarm trio of satellites.

The magnetic field protects us from cosmic radiation and charged particles that bombard Earth, but it is in a permanent state of flux. Magnetic north wanders, and every few hundred thousand years the polarity flips so that a compass would point south instead of north. Moreover, the strength of the magnetic field constantly changes – and it is currently showing signs of significant weakening.

The field is particularly weak over the South Atlantic Ocean – known as the South Atlantic Anomaly. This weak field has indirectly caused many temporary satellite ‘hiccups’ (called Single Event Upsets) as the satellites are exposed to strong radiation over this area.

Video credit: ESA/Dot2Dot

Note: For more information, see June 2014 Magnetic Field.

Wednesday, June 18, 2014

X-Ray Pulsar SXP 1062


Massive stars end their lives with a bang: exploding as spectacular supernovas, they release huge amounts of mass and energy into space. These explosions sweep up any surrounding material, creating bubble remnants that expand into interstellar space. At the heart of bubbles like these are small, dense neutron stars or black holes, the remains of what once shone brightly as a star.

Since supernova-carved bubbles shine for only a few tens of thousands of years before dissolving, it is rare to come across neutron stars or black holes that are still enclosed within their expanding shell. This image captures such an unusual scene, featuring both a strongly magnetized, rotating neutron star – known as a pulsar – and its cosmic cloak, the remains of the explosion that generated it.

This pulsar, named SXP 1062, lies in the outskirts of the Small Magellanic Cloud, one of the satellite galaxies of our Milky Way galaxy. It is an object known as an X-ray pulsar: it hungrily gobbles up material from a nearby companion star and burps off X-rays as it does so. In the future, this scene may become even more dramatic, as SXP 1062 has a massive companion star that has not yet exploded as a supernova.

Most pulsars whirl around incredibly quickly, spinning many times per second. However, by exploring the expanding bubble around this pulsar and estimating its age, astronomers have noticed something intriguing: SXP 1062 seems to be rotating far too slowly for its age. It is actually one of the slowest pulsars known.

While the cause of this weird sluggishness is still a mystery, one explanation may be that the pulsar has an unusually strong magnetic field, which would slow the rotation.

The diffuse blue glow at the center of the bubble in this image represents X-ray emission from both the pulsar and the hot gas that fills the expanding bubble. The other fuzzy blue objects visible in the background are extragalactic X-ray sources.

This image combines X-ray data from ESA’s XMM-Newton (shown in blue) with optical observations from the Cerro Tololo Inter-American Observatory in Chile. The optical data were obtained using two special filters that reveal the glow of oxygen (shown in green) and hydrogen (shown in red). The size of the image is equivalent to a distance of 457 light-years on a side.

This image was first published on ESA’s Science and Technology website in 2011. It is based on data from the paper “Discovery of a Be/X-ray pulsar binary and associated supernova remnant in the Wing of the Small Magellanic Cloud” by V. Hénault-Brunet, et al. 2012.

Image credit: ESA/XMM-Newton/ L. Oskinova/M. Guerrero; CTIO/R. Gruendl/Y.H. Chu

Note: The above image was first published on this blog in December 2011; however, the above text is different and provides additional information.

Wednesday, June 4, 2014

Xi1 Canis Majoris


X-ray emission from the B-type star Xi1 Canis Majoris (Xi1 CMa) – seen in the center of this image - has been measured using ESA's XMM-Newton observatory.

Xi1 CMa was observed continuously with XMM-Newton in October 2012 for almost 29 hours. These observations resulted in the first detection of pulsed X-ray emission from a non-degenerate, massive star.

Xi1 CMa is an extremely bright star with a surface temperature of approximately 27,500K, and a mass of approximately 15 times that of the Sun. It lies some 1400 light years away in the constellation Canis Major. The star has a notably strong magnetic field, about 5000 times stronger than our Sun's.

This 3-colour image of the field was made by mapping 0.2-1.0 keV emission to red, 1.0-2.5 keV emission to green, and 2.5-10.0 keV emission to blue. The field of view of this image is 19 arcmin × 19 arcmin (approximately 7.6 light years × 7.6 light years).

Image credit: ESA/XMM-Newton/L. Oskinova (University of Potsdam)

Note: For more information, see Pulsating X-Rays Allow XMM-Newton to Unmask a Mysterious Star.

Friday, May 9, 2014

The Milky Way's Magnetic Field and Dust Polarization


The magnetic field of our Milky Way Galaxy as seen by ESA's Planck satellite. This image was compiled from the first all-sky observations of polarized light emitted by interstellar dust in the Milky Way. The magnetic field is displayed using a visualization technique called line integral convolution (LIC).

Darker regions correspond to stronger polarized emission, and the striations indicate the direction of the magnetic field projected on the plane of the sky. The dark band running horizontally across the center corresponds to the Galactic Plane. Here, the polarization reveals a regular pattern on large angular scales, which is due to the magnetic field lines being predominantly parallel to the plane of the Milky Way. The data also reveal variations of the polarization direction within nearby clouds of gas and dust. This can be seen in the tangled features above and below the plane, where the local magnetic field is particularly disorganized.

The image is a Mollweide projection of the full celestial sphere, with the plane of the Galaxy aligned with the horizontal axis of the oval. Certain areas in the image, mostly at high Galactic latitude, have been masked out. The overall intensity in these regions is low, complicating the separation of foreground and CMB components. Further data analysis will improve this by the time of the full data release in late 2014.

Image credit: ESA and the Planck Collaboration

Note: For more information, see Planck Takes Magnetic Fingerprint of Our Galaxy, Milky Way's Magnetic Fingerprint, PIA18048: Magnetic Map of Milky Way and Planck Takes Magnetic Fingerprint of Our Galaxy.

Tuesday, March 11, 2014

Planetary Formation Through Magnetic Fields


Magnetic loops carry gas and dust above disks of planet-forming material circling stars, as shown in this artist's conception. These loops give off extra heat, which NASA's Spitzer Space Telescope detects as infrared light. The colors in this illustration show what an alien observer with eyes sensitive to both visible light and infrared wavelengths might see.

Illustration credit: NASA/JPL-Caltech

Note: For more information, see Mystery of Planet-forming Disks Explained by Magnetism.

Saturday, February 22, 2014

Bow Shock Wave from Kappa Cassiopeiae


The red arc in this infrared image from NASA's Spitzer Space Telescope is a giant shock wave, created by a speeding star known as Kappa Cassiopeiae.

Roguish runaway stars can have a big impact on their surroundings as they plunge through the Milky Way galaxy. Their high-speed encounters shock the galaxy, creating arcs, as seen in this newly released image from NASA's Spitzer Space Telescope.

In this case, the speedster star is known as Kappa Cassiopeiae, or HD 2905 to astronomers. It is a massive, hot supergiant moving at around 2.5 million mph relative to its neighbors (1,100 kilometers per second). But what really makes the star stand out in this image is the surrounding, streaky red glow of material in its path. Such structures are called bow shocks, and they can often be seen in front of the fastest, most massive stars in the galaxy.

Bow shocks form where the magnetic fields and wind of particles flowing off a star collide with the diffuse, and usually invisible, gas and dust that fill the space between stars. How these shocks light up tells astronomers about the conditions around the star and in space. Slow-moving stars like our sun have bow shocks that are nearly invisible at all wavelengths of light, but fast stars like Kappa Cassiopeiae create shocks that can be seen by Spitzer's infrared detectors.

Incredibly, this shock is created about 4 light-years ahead of Kappa Cassiopeiae, showing what a sizable impact this star has on its surroundings. (This is about the same distance that we are from Proxima Centauri, the nearest star beyond the sun.)

The Kappa Cassiopeiae bow shock shows up as a vividly red color. The faint green features in this image result from carbon molecules, called polycyclic aromatic hydrocarbons, in dust clouds along the line of sight that are illuminated by starlight.

Delicate red filaments run through this infrared nebula, crossing the bow shock. Some astronomers have suggested these filaments may be tracing out features of the magnetic field that runs throughout our galaxy. Since magnetic fields are completely invisible themselves, we rely on chance encounters like this to reveal a little of their structure as they interact with the surrounding dust and gas.

Kappa Cassiopeiae is visible to the naked eye in the Cassiopeia constellation (but its bow shock only shows up in infrared light.)

For this Spitzer image, infrared light at wavelengths of 3.6 and 4.5 microns is rendered in blue, 8.0 microns in green, and 24 microns in red.

Image credit: NASA/JPL-Caltech

Monday, January 13, 2014

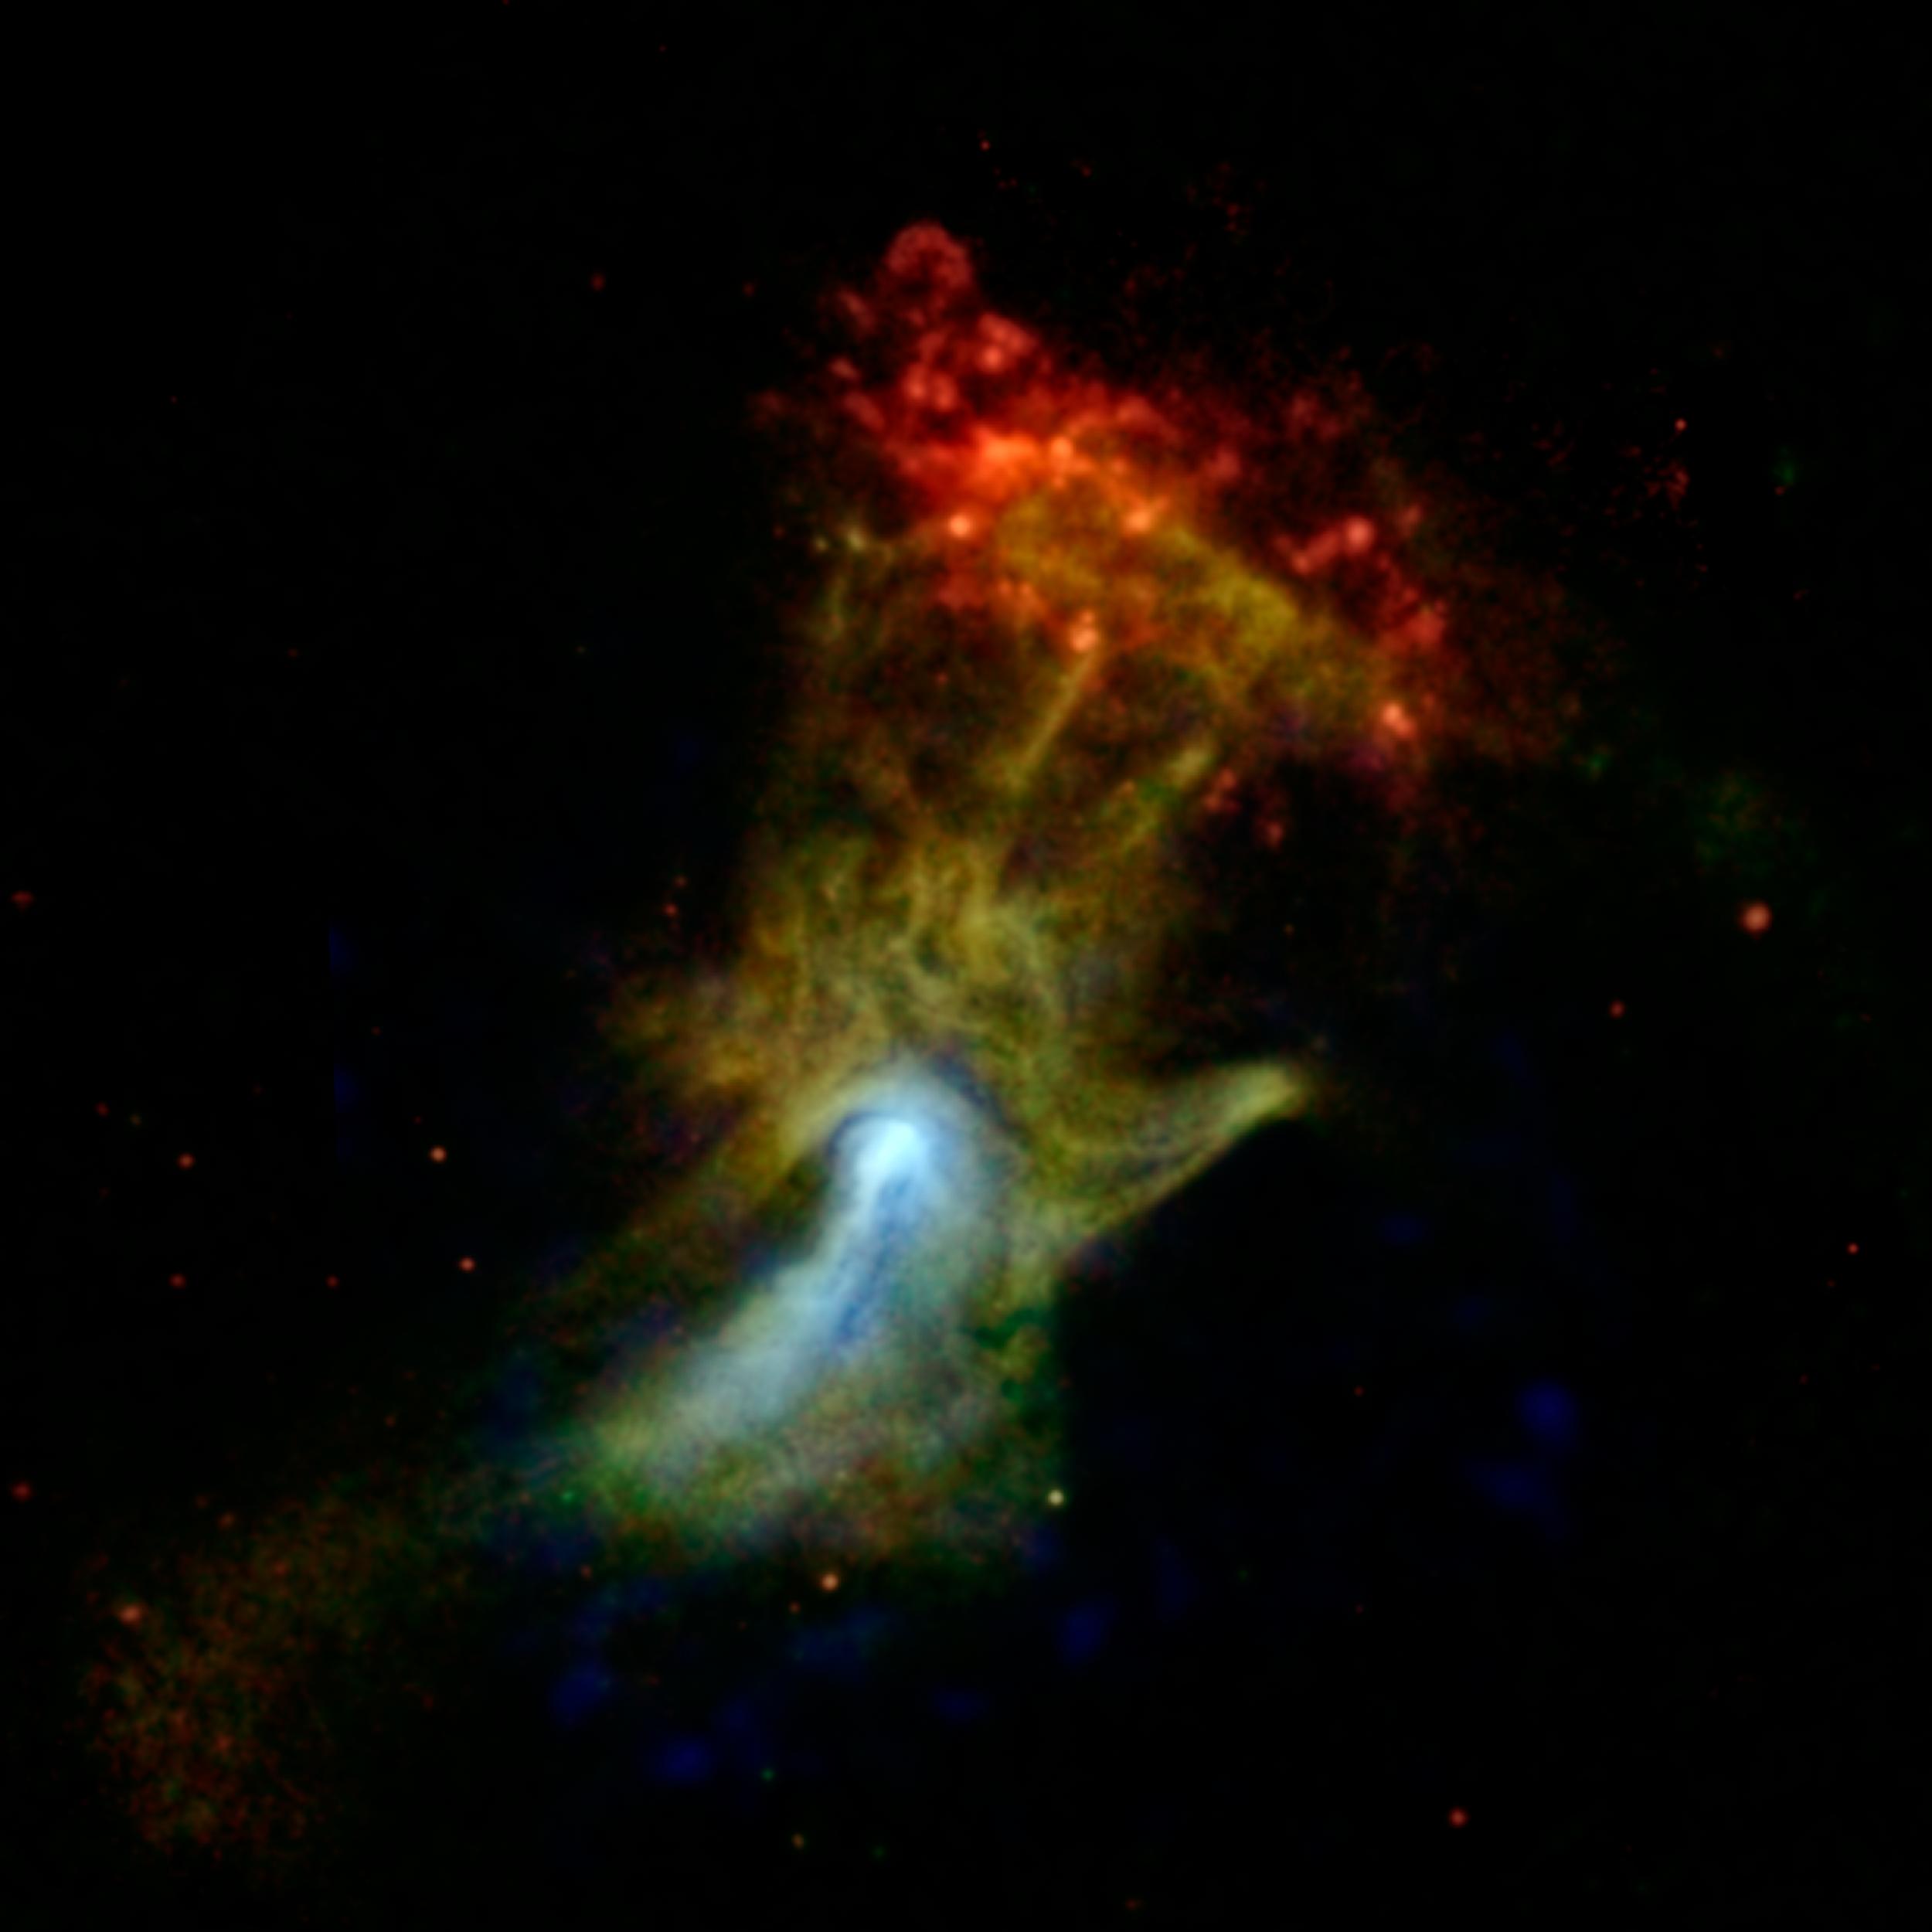
Pulsar Wind Nebula PSR B1509-58


Can you see the shape of a hand in this new X-ray image? The hand might look like an X-ray from the doctor's office, but it is actually a cloud of material ejected from a star that exploded. NASA's Nuclear Spectroscopic Telescope Array, or NuSTAR, has imaged the structure in high-energy X-rays for the first time, shown in blue. Lower-energy X-ray light previously detected by NASA's Chandra X-ray Observatory is shown in green and red.

Nicknamed the "Hand of God," this object is called a pulsar wind nebula. It's powered by the leftover, dense core of a star that blew up in a supernova explosion. The stellar corpse, called PSR B1509-58, or B1509 for short, is a pulsar: it rapidly spins around, seven times per second, firing out a particle wind into the material around it -- material that was ejected in the star's explosion. These particles are interacting with magnetic fields around the material, causing it to glow with X-rays. The result is a cloud that, in previous images, looked like an open hand. The pulsar itself can't be seen in this picture, but is located near the bright white spot.

One of the big mysteries of this object is whether the pulsar particles are interacting with the material in a specific way to make it look like a hand, or if the material is in fact shaped like a hand.

NuSTAR's view is providing new clues to the puzzle. The hand actually shrinks in the NuSTAR image, looking more like a fist, as indicated by the blue color. The northern region, where the fingers are located, shrinks more than the southern part, where a jet lies, implying the two areas are physically different.

The red cloud at the end of the finger region is a different structure, called RCW 89. Astronomers think the pulsar's wind is heating the cloud, causing it to glow with lower-energy X-ray light.

In this image, X-ray light seen by Chandra with energy ranges of 0.5 to 2 kiloelectron volts (keV) and 2 to 4 keV is shown in red and green, respectively, while X-ray light detected by NuSTAR in the higher-energy range of 7 to 25 keV is blue.

Image credit: NASA/JPL-Caltech/McGill

Note: For more information, see PIA17567: Different Flavors of Black Holes and Dead Star and Distant Black Holes Dazzle in X-Rays.

Wednesday, December 25, 2013

The Sounds of Interstellar Space


Scifi movies are sometimes criticized when explosions in the void make noise. As the old saying goes, “in space, no one can hear you scream.” Without air there is no sound.

But if that’s true, what was space physicist Don Gurnett talking about when he stated at a NASA press conference in September 2013 that he had heard "the sounds of interstellar space?"

It turns out that space can make music … if you know how to listen.

Gurnett is the James Van Allen professor of physics at the University of Iowa and the principal investigator for the Plasma Wave Science instrument on Voyager 1. At the press conference, he played some plasma wave data for the audience. The sounds, he explained, were solid evidence that Voyager 1 had left the heliosphere.

The heliosphere is a vast bubble of magnetism that surrounds the sun and planets. It is, essentially, the sun’s magnetic field inflated to enormous proportions by the solar wind. Inside the heliosphere is "home." Outside lies interstellar space, the realm of the stars.

For decades, researchers have been on the edge of their seats, waiting for the Voyager probes to leave. Ironically, it took almost a year for NASA to realize the breakthrough had occurred. The reason is due to the slow cadence of transmissions from the distant spacecraft. Data stored on old-fashioned tape recorders are played back at three to six month intervals. Then it takes more time to process the readings.

Gurnett recalls the thrill of discovery when some months-old data from the Plasma Wave Instrument reached his desk in the summer of 2013. The distant tones were conclusive: “Voyager 1 had made the crossing.”

Strictly speaking, the plasma wave instrument does not detect sound. Instead it senses waves of electrons in the ionized gas or "plasma" that Voyager travels through. No human ear could hear these plasma waves. Nevertheless, because they occur at audio frequencies, between a few hundred and a few thousand hertz, "we can play the data through a loudspeaker and listen," says Gurnett. "The pitch and frequency tell us about the density of gas surrounding the spacecraft."

When Voyager 1 was inside the heliosphere, the tones were low, around 300 Hz, typical of plasma waves coursing through the rarified solar wind. Outside, the frequency jumped to a higher pitch, between 2 and 3 kHz, corresponding to denser gas in the interstellar medium. The transition music to Gurnett’s ears.

So far, Voyager 1 has recorded two outbursts of "interstellar plasma music"--one in October-November 2012 and a second in April-May 2013. Both were excited by bursts of solar activity.

“We need solar events to trigger plasma oscillations,” says Gurnett.

The key players are CMEs, hot clouds of gas that blast into space when solar magnetic fields erupt. A typical CME takes 2 or 3 days to reach Earth, and a full year or more to reach Voyager. When a CME passes through the plasma, it excites oscillations akin to fingers strumming the strings on a guitar. Voyager’s Plasma Wave Instrument listens … and learns.

“We’re in a totally unexplored region of space,” says Gurnett. “I expect some surprises out there.”

In particular, Gurnett is hoping for plasma waves not excited by solar storms. He speculates that shock fronts from outside the solar system could be rippling through the interstellar medium. If so, they would excite new plasma waves that Voyager 1 will encounter as it plunges ever deeper into the realm of the stars.

The next "sounds" from out there could be surprising indeed.

Video credit: NASA

Wednesday, September 11, 2013

Earth's Plasmasphere and the Van Allen Belts


These three panels show how the relative locations of the outer boundary of the Earth's plasmasphere, the plasmapause, (shown in blue) and the van Allen belts (shown in red) change according to geomagnetic conditions.

The plasmasphere – the innermost part of the Earth's magnetosphere – is a doughnut-shaped region of low energy charged particles (cold plasma) centered around the planet's equator and rotating along with it. Its toroidal shape is determined by the magnetic field of Earth. The plasmasphere begins above the upper ionosphere and extends outwards, with the outer boundary varying (depending on geomagnetic conditions) from 4.5 Earth radii (RE) to 8 RE.

The two Van Allen radiation belts are concentric, tire-shaped belts (shown in blue) of highly energetic (0.1–10 MeV) electrons and protons, which are trapped by the magnetic field and travel around the Earth. These radiation belts partly overlap with the plasmasphere. The inner Van Allen belt is located typically between 6000 and 12,000 km (1 - 2 Earth radii [RE]) above Earth's surface, although it dips much closer over the South Atlantic Ocean. The outer radiation belt covers altitudes of approximately 25,000 to 45,000 km (4 to 7 RE).

Both belts are separated from each other by an empty "slot" region. A temporary third belt (not shown in this image), between this slot and the outer main belt, was detected in 2013 by NASA's Van Allen Probes.

Data from the Cluster mission have shown that the position of the plasmapause – the outer boundary of the plasmasphere – is quite variable and, in addition, that the size of the slot region between the radiation belts varies with changes in geomagnetic conditions.

During periods of low geomagnetic activity (top panel) the plasmapause typically extends to around 6 RE, occasionally expanding beyond the boundary of the outer radiation belt, as far as 8 RE or even further. This result contrasts with previous studies based on observations from different spacecraft which indicated a correlation between the position of the plasmapause and the location of the inner edge of the outer belt.

During periods of higher geomagnetic activity (with moderate activity illustrated in the central panel and high activity in the lower panel) the plasmapause moves closer to the inner boundary of the outer belt, to around 4.5 RE. This behavior is similar to that observed by previous studies. (Note that the outer radiation belt also moves, but at a slower rate, towards the Earth.)

The size of the slot region also varies with geomagnetic conditions, being wider during low geomagnetic activity.

Illustration credit: ESA - C. Carreau

Note: For more information, see Cluster Shows Plasmasphere Interacting with Van Allen Belts.

Saturday, August 10, 2013

The Sun's Magnetic Field is About to Flip


Something big is about to happen on the sun. According to measurements from NASA-supported observatories, the sun's vast magnetic field is about to flip.

"It looks like we're no more than 3 to 4 months away from a complete field reversal," says solar physicist Todd Hoeksema of Stanford University. "This change will have ripple effects throughout the solar system."

The sun's magnetic field changes polarity approximately every 11 years. It happens at the peak of each solar cycle as the sun's inner magnetic dynamo re-organizes itself. The coming reversal will mark the midpoint of Solar Cycle 24. Half of 'Solar Max' will be behind us, with half yet to come.

Hoeksema is the director of Stanford's Wilcox Solar Observatory, one of the few observatories in the world that monitor the sun's polar magnetic fields. The poles are a herald of change. Just as Earth scientists watch our planet's polar regions for signs of climate change, solar physicists do the same thing for the sun. Magnetograms at Wilcox have been tracking the sun's polar magnetism since 1976, and they have recorded three grand reversals—with a fourth in the offing.

Solar physicist Phil Scherrer, also at Stanford, describes what happens: "The sun's polar magnetic fields weaken, go to zero, and then emerge again with the opposite polarity. This is a regular part of the solar cycle."

A reversal of the sun's magnetic field is, literally, a big event. The domain of the sun's magnetic influence (also known as the "heliosphere") extends billions of kilometers beyond Pluto. Changes to the field's polarity ripple all the way out to the Voyager probes, on the doorstep of interstellar space.

When solar physicists talk about solar field reversals, their conversation often centers on the "current sheet." The current sheet is a sprawling surface jutting outward from the sun's equator where the sun's slowly-rotating magnetic field induces an electrical current. The current itself is small, only one ten-billionth of an amp per square meter (0.0000000001 amps/m2), but there’s a lot of it: the amperage flows through a region 10,000 km thick and billions of kilometers wide. Electrically speaking, the entire heliosphere is organized around this enormous sheet.

During field reversals, the current sheet becomes very wavy. Scherrer likens the undulations to the seams on a baseball. As Earth orbits the sun, we dip in and out of the current sheet. Transitions from one side to another can stir up stormy space weather around our planet.

Cosmic rays are also affected. These are high-energy particles accelerated to nearly light speed by supernova explosions and other violent events in the galaxy. Cosmic rays are a danger to astronauts and space probes, and some researchers say they might affect the cloudiness and climate of Earth. The current sheet acts as a barrier to cosmic rays, deflecting them as they attempt to penetrate the inner solar system. A wavy, crinkly sheet acts as a better shield against these energetic particles from deep space.

As the field reversal approaches, data from Wilcox show that the sun's two hemispheres are out of synch.

"The sun's north pole has already changed sign, while the south pole is racing to catch up," says Scherrer. "Soon, however, both poles will be reversed, and the second half of Solar Max will be underway."

When that happens, Hoeksema and Scherrer will share the news with their colleagues and the public.

Video credit: NASA

Monday, July 22, 2013

IBEX Maps the Sun's Heliotail


Like a comet, the solar system has a tail. NASA's Interstellar Boundary Explorer (IBEX) has for the first time mapped out the structure of this tail, which is shaped like a four-leaf clover.

Scientists describe the tail, called the heliotail, based on the first three years of IBEX imagery in a paper published in the July 10 edition of the Astrophysical Journal.

While telescopes have spotted such tails around other stars, it has been difficult to see whether our star produced one. The particles found in the tail -- and throughout the entire heliosphere, the region of space influenced by our sun -- do not shine, so they cannot be seen with conventional instruments.

"By examining the neutral atoms, IBEX has made the first observations of the heliotail," said David McComas, IBEX principal investigator at Southwest Research Institute in San Antonio, Texas, and the paper's lead author. "Many models have suggested the heliotail might look like this or like that, but we have had no observations. We always drew pictures where the tail of the solar system just trailed off the page, since we couldn't even speculate about what it really looked like."


Other stars show tails that trail behind them like a comet’s tail; [pictured above is the star Mira and its tail, shown in ultraviolet light and imaged by the GALEX satellite]. Scientists used NASA’s Interstellar Boundary Explorer to confirm that our solar system has one too.

IBEX measures the neutral particles created by collisions at the solar system's boundaries. This technique, called energetic neutral atom imaging, relies on the fact that the paths of neutral particles are not affected by the solar magnetic field. Instead, the particles travel in a straight line from collision to IBEX. Consequently, observing where the neutral particles came from describes what is going on in these distant regions.

"Since first light in 2008, the IBEX mission team has amazed us with its discoveries at the interstellar boundary, including a previously unknown ribbon of energetic neutral particles stretching across it," said Arik Posner, NASA's IBEX program scientist in Washington. "The new IBEX image of the heliotail fills in a previously blank area on the map. We are first-hand witnesses of rapid progress in heliophysics science."

By combining observations from the first three years of IBEX imagery, the team showed a tail with a combination of fast and slow moving particles. There are two lobes of slower particles on the sides and faster particles above and below. This four-leaf clover shape can be attributed to the fact that the sun has been sending out fast solar wind near its poles and slower wind near its equator for the last few years. This is a common pattern in the most recent phase of the sun's 11-year activity cycle.

The clover shape does not align perfectly with the solar system, however. The entire shape is rotated slightly, indicating that as it moves further away from the sun and its magnetic influence, the charged particles begin to be nudged into a new orientation, aligning with the magnetic fields from the local galaxy.

Scientists do not know how long the tail is, but think that it eventually fades away and becomes indistinguishable from the rest of interstellar space. Scientists are testing their current computer simulations of the solar system against the new observations to improve our understanding of the comet-like tail streaming out behind us.

Video credit: NASA; image credit: NASA/JPL-Caltech/GALEX

Friday, May 24, 2013

SGR 0418+5729


SGR 0418+5729: A magnetar located in our galaxy, about 6,500 light years from Earth.

This graphic shows a magnetar called SGR 0418+5729 (SGR 0418 for short), a type of neutron star that has a relatively slow spin rate and generates occasional large blasts of X-rays. Most magnetars have extremely high magnetic fields on their surface that are ten to a thousand times stronger than for the average neutron star. New data from NASA’s Chandra X-ray Observatory, ESA’s XMM-Newton and NASA's Swift and RXTE satellites shows that SGR 0418 is exceptional, with a surface magnetic field similar to that of mainstream neutron stars. In the image on the left, data from Chandra shows SGR 0418 as a pink source in the middle. Optical data from the William Herschel telescope in La Palma and infrared data from NASA’s Spitzer Space Telescope are shown in red, green and blue. On the right is an artist’s impression giving a close-up view of SGR 0418. This illustration highlights the weak surface magnetic field of the magnetar, and the relatively strong, wound-up magnetic field lurking in the hotter interior of the star. SGR 0418 is located about 6,500 light years from Earth.

Scale: Image is about 2 arcmin across. (about 3 light years).

Image credit: X-ray: NASA/CXC/CSIC-IEEC/N.Rea et al; Optical: Isaac Newton Group of Telescopes, La
Palma/WHT; Infrared: NASA/JPL-Caltech; Illustration: NASA/CXC/M.Weiss.

Note: For more information, see SGR 0418+5729: A Hidden Population of Exotic Neutron Stars.

Thursday, April 18, 2013

Energy From Above Affecting Surface of Europa


This graphic of Jupiter's moon Europa maps a relationship between the amount of energy deposited onto the moon from charged-particle bombardment and the chemical contents of ice deposits on the surface in five areas of the moon (labeled A through E).

Energetic ions and electrons tied to Jupiter's powerful magnetic field smack into Europa as the field sweeps around Jupiter. The magnetic field travels around Jupiter even faster than Europa orbits the planet. Most of the energetic particles hitting Europa strike the moon's "trailing hemisphere," the half facing away from the direction Europa travels in its orbit. The "leading hemisphere," facing in the direction of travel, receives fewer of the charged particles.

Researchers assessed the amount of sulfate hydrates -- compared with relatively pristine water -- in the surface ice in five widely distributed areas of Europa. They used data from observations made by the near infrared spectrometer (NIMS) instrument on NASA's Galileo spacecraft, which orbited Jupiter from 1995 to 2003. They found that the concentration of frozen sulfuric acid on the surface varies greatly. It ranges from undetectable levels near the center of Europa's leading hemisphere, to more than half of the surface material near the center of the trailing hemisphere. The concentration is closely related to the amount of energy received from electrons and sulfur ions striking the surface, with a distribution controlled by interactions between Jupiter and Europa's magnetic fields.

This pattern could provide direction for the best places to study the surface of Europa for learning about material churned up from the moon's subsurface, which includes a deep saltwater ocean beneath an icy shell. The portions of the surface least affected by the bombardment of charged particles from above are most likely to preserve the original chemical compounds that erupted from the interior. Understanding the chemical ingredients of Europa's subsurface ocean could help scientists determine whether, as many suspect, the ocean could have supported life in the past or even now.

The images of Europa used for the base maps of this figure were taken by the solid state imager on Galileo. The areas labeled A through E are the areas covered by five sets of NIMS observations, and color-coded with darker, bluer portions having more sulfate hydrates and brighter, pinker portions having more water ice. The mapped patterns for energy input are derived from models for the flux of electrons and ions delivered by Jupiter's magnetic field. The color-code key at the right is labeled in units of mega electron volts per square centimeter per second.

Image Credit: NASA/JPL-Caltech/University of Arizona/JHUAPL/University of Colorado

Note: For more information, see Where are the Best Windows Into Europa's Interior?

Thursday, March 21, 2013

NASA Voyager Status Update on Voyager 1 Location


"The Voyager team is aware of reports today that NASA's Voyager 1 has left the solar system," said Edward Stone, Voyager project scientist based at the California Institute of Technology, Pasadena, California. "It is the consensus of the Voyager science team that Voyager 1 has not yet left the solar system or reached interstellar space. In December 2012, the Voyager science team reported that Voyager 1 is within a new region called 'the magnetic highway' where energetic particles changed dramatically. A change in the direction of the magnetic field is the last critical indicator of reaching interstellar space and that change of direction has not yet been observed."

Image credit: NASA/JPL-Caltech

Wednesday, February 20, 2013

Voyager 1 in the Depletion Region


This artist's concept shows NASA's Voyager 1 spacecraft in a new region at the edge of our solar system where the magnetic field lines generated by our sun are piling up and intensifying. Voyager 1 is in an area scientists are calling the depletion region where the magnetic field acts as a kind of "magnetic highway." In this region, energetic ions from inside the heliosphere, the magnetic bubble that the sun blows around itself, escape out, and energetic ions from interstellar space zoom in. (To learn more about how this region acts as a magnetic highway, see PIA16486.) The depletion region is the outermost known layer of the heliosphere.

Magnetic field lines form a spiral around the solar system because of the rotation of the sun (see PIA15179), and at the edge of the solar system they form roughly parallel lines. At the end of 2004, Voyager 1 passed the termination shock, where the solar wind abruptly slowed down and compressed, and the intensity of the magnetic field tripled as the distance between magnetic field lines decreased by one-third. By mid-2010, Voyager entered a stagnation region where the wind slowed almost to a stop and the magnetic field intensity increased twice again as the magnetic field lines were pressed closer together. In August 2012, Voyager 1 entered the outermost known layer where the depletion of energetic ions allowed the field lines to compress even closer together. Scientists believe the field lines are piling up because an interstellar wind outside is pushing back.

Illustration credit: NASA/JPL-Caltech

Wednesday, February 6, 2013

The Ionosphere of Venus Under Different Solar Wind Conditions


A comparison of the ionosphere of Venus under different solar wind conditions. The yellow lines indicate the solar magnetic field lines as they interact with the ionosphere.

When the solar wind's dynamic pressure is normal (left image) the ionosphere is confined to a region 150-300 km above the planet's day side. Positively charged particles (ions) travel quite quickly across the day-night terminator to create a similar ionosphere on the planet's night side.

When the solar wind pressure drops to a very low level (right image), the ionosphere expands to a higher altitude above the day side of Venus and weaker magnetic fields are created above the terminator. As a result, the region across which ions are able to travel from the day side to the night side becomes larger. This makes it easier for ions to flow across the terminator. Although the weaker pressure of the solar wind reduces the speed at which the ions travel toward the night side, the first effect outweighs the second, enabling the ionosphere to expand in the planet's wake. Observations from Venus Express show that the night-side ionosphere moved outward to at least 15,000 km from Venus' center over a period of only a few hours, creating a long, comet-like tail.

Illustration credit: ESA/Wei et al (2012)

Note: For more information, see The Tail of Venus and the Weak Solar Wind and Comet-Like Ionosphere at Venus.