Pages

Showing posts with label Sloan Digital Sky Survey. Show all posts

Monday, September 15, 2014

Supernova Gaia14aaa and Its Host Galaxy


This image shows the supernova named Gaia14aaa as seen on 10 September 2014 with the robotic Liverpool Telescope on La Palma, in the Canary Islands, Spain. This is a Type Ia supernova – the explosion of a white dwarf locked in a binary system with a companion star – and it was discovered in the data collected with ESA’s Gaia satellite on 30 August.

In the left panel, the image from the Liverpool Telescope shows both Gaia14aaa and its host galaxy, named SDSS J132102.26+453223.8, which is about 500 million light-years away. In this image, the supernova is slightly offset from the galaxy’s core.

The central panel shows an image of the same galaxy, taken as part of the Sloan Digital Sky Survey, several years before the explosion of Gaia14aaa could be observed from Earth.

The right panel was obtained by subtracting the second image, which contains the light emitted by the galaxy, from the first one, which depicts both the galaxy and the supernova. The difference between the two images clearly shows the appearance of Gaia14aaa.

Image credit: M. Fraser/S. Hodgkin/L. Wyrzykowski/H. Campbell/N. Blagorodnova/Z. Kostrzewa-Rutkowska/Liverpool Telescope/SDSS

Note: For more information, see Gaia Discovers Its First Supernova.

Wednesday, March 19, 2014

Cosmic Dust Survey by Herschel and SDSS


Collage of galaxies in the Herschel Reference Survey at infrared/submillimeter wavelengths by Herschel (left) and at visible wavelengths from the Sloan Digital Sky Survey (SDSS, right). The Herschel image is colored with blue representing cold dust and red representing warm dust; the SDSS image shows young stars in blue and old stars in red. Together, the observations plot young, dust-rich spiral/irregular galaxies in the top left, with giant dust-poor elliptical galaxies in the bottom right.

Image credit: ESA/Herschel/HRS-SAG2 and HeViCS Key Programmes/Sloan Digital Sky Survey/ L. Cortese (Swinburne University)

Note: For more information, see Herschel Completes Largest Survey of Cosmic Dust in Local Universe and Herschel Survey in Infrared.

Tuesday, November 19, 2013

UGC 10288


The edge-on spiral galaxy UGC 10288 appeared to be a single object in previous observations. However, new detailed radio data from the NRAO's Jansky Very Large Array (VLA) revealed that the large perpendicular extension of UGC 10288's halo (blue) is really a distant background galaxy with radio jets.

This image of UGC 10288 in the foreground is created with data spanning optical, infrared and radio energies. Radio data are blue, and infrared observations from NASA's Spitzer Space Telescope and Wide-field Infrared Survey Explorer (WISE) are yellow and orange, respectively. Optical data from the Sloan Digital Sky Survey are purplish blue and show starlight; and optical data from the Kitt Peak National Observatory are rose and show heated gas.

Image credit: NASA/JPL-Caltech/NRAO/SDSS/NOAO/University of Manitoba

Note: For more information, see Nature Pulls a Fast One on Astronomers.

Friday, September 20, 2013

Coma Cluster


Coma Cluster: A collection of thousands of galaxies about 320 million light years from Earth.

Enormous arms of hot gas have been revealed in the Coma galaxy cluster in data from NASA's Chandra X-ray Observatory and ESA's XMM-Newton. A specially processed Chandra image (pink) has been combined with optical data from the Sloan Digital Sky Survey (white and blue) to highlight these spectacular arms. Researchers think that these arms -- which span at least a half million light years -- were most likely formed when smaller galaxy clusters had their gas stripped away by the head wind created by the motion of the clusters through the hot gas.

Scale: Image is 23 arcmin on a side (about 2 million light years).

Image credit: X-ray: NASA/CXC/MPE/J.Sanders et al, Optical: SDSS

Note: For more information, see Coma Cluster: Clues to the Growth of the Colossus in Coma

Sunday, September 8, 2013

Massive Black Holes Near IC 751


An optical color image of galaxies is seen here overlaid with X-ray data (magenta) from NASA's Nuclear Spectroscopic Telescope Array (NuSTAR).

NuSTAR's serendipitous discovery in this field, indicated by the arrow (Figure 1), lies to the left of a galaxy, called IC751, at which the telescope originally intended to look. Both magenta blobs show X-rays from massive black holes buried at the hearts of galaxies.

The optical image is from the Sloan Digital Sky Survey and a color composite of images over three different optical wavebands (the G, R, and I bands). The NuSTAR data shows X-rays in the 3 to 24 keV energy range.

Image credit: NASA/JPL-Caltech

Note: For more information, see Catching Black Holes on the Fly.

Sunday, August 4, 2013

Abell 2199 and ISCS 1433.9+3330


This image shows two of the galaxy clusters observed by NASA's Wide-field Infrared Survey Explorer (WISE) and Spitzer Space Telescope missions. Galaxy clusters are among the most massive structures in the universe. The central and largest galaxy in each grouping, called the brightest cluster galaxy or BCG, is seen at the center of each image.

Figure 1 shows the cluster known as Abell 2199, which is relatively nearby at a distance of 400 million light-years from Earth (redshift of 0.0302). This image combines infrared data from WISE (in red) with shorter wavelengths of light extending into the visible spectrum from the Sloan Digital Sky Survey (in blue and green).

Figure 2 is the cluster ISCS 1433.9+3330, which is significantly farther away at a distance of 4.4 billion light-years (redshift of 0.42). Infrared data from Spitzer (red) is combined with similar shorter wavelength data taken by the Mayall Telescope on Kitt Peak, Arizona.

Photo credit: NASA/JPL-Caltech/SDSS/NOAO

Note: For more information, see Monster Galaxies Lose Their Appetite With Age.

Friday, October 26, 2012

NGC 4178


NGC 4178: A black hole located in the middle of the spiral galaxy NGC 4178.

One of the lowest mass supermassive black holes ever observed in the middle of a galaxy has been identified, thanks to NASA's Chandra X-ray Observatory and several other observatories. The black hole is located in the middle of the spiral galaxy NGC 4178, shown in this image from the Sloan Digital Sky Survey. The inset shows an X-ray source at the position of the black hole, in the center of a Chandra image. An analysis of the Chandra data, along with infrared data from NASA's Spitzer Space Telescope and radio data from the NSF's Very Large Array suggests that the black hole has a mass less than about 200,000 times that of the sun, near the extreme low-mass end of the supermassive black hole range. The host galaxy is of a type not expected to harbor supermassive black holes, suggesting that this black hole, while related to its supermassive cousins, may have a different origin.

Scale: Main image: 10 arcmin across (about 160,000 light years).

Image credit: X-ray: NASA/CXC/George Mason Univ/N.Secrest et al; Optical: SDSS

Note: For more information, see NGC 4178: Revealing a Mini-Supermassive Black Hole.

Saturday, July 14, 2012

A Swarm of Dark Matter Around the Milky Way


These illustrations, taken from computer simulations, show a swarm of dark matter clumps around our Milky Way galaxy. Some of the dark-matter concentrations are massive enough to spark star formation. Dark matter is an invisible substance that accounts for most of the universe's mass.

In the first panel, thousands of clumps of dark matter coexist with our Milky Way galaxy, shown in the center.

The green blobs in the second panel are those dark-matter chunks massive enough to obtain gas from the intergalactic medium and trigger ongoing star formation, eventually creating dwarf galaxies.

In the third panel, the red blobs are ultra-faint dwarf galaxies that stopped forming stars long ago. New Hubble Space Telescope observations of three of the puny galaxies reveal that star-making in these faint galaxies shut down more than 13 billion years ago.

The synchronized shutdown is evidence that a global event, such as reionization, swept through the early universe. Reionization is a transitional phase in the early universe when the first stars burned off a fog of cold hydrogen.

Popular theory predicts that most of the Milky Way's satellites contain few, if any, stars and are instead dominated by dark matter. More than a dozen small-fry galaxies have been found so far, all by the Sloan Digital Sky Survey, which scanned just a quarter of the sky.

Illustration credit: J. Tumlinson (STScI)

Note: For more information, see Hubble Unmasks Ghost Galaxies.

Saturday, April 7, 2012

NGC 3801: The Beginning of the End of Star Formation


Time is running out for the galaxy NGC 3801, seen in this composite image combining light from across the spectrum, ranging from ultraviolet to radio. NASA's Galaxy Evolution Explorer and other instruments have helped catch the galaxy NGC 3801 in the act of destroying its cold, gaseous fuel for new stars. Astronomers believe this marks the beginning of its transition from a vigorous spiral galaxy to a quiescent elliptical galaxy whose star-forming days are long past.

Visible light from the Sloan Digital Sky Survey is seen in yellow shining from all of the galaxy's stars. Notice that NGC 3801 is starting to possess a broadly elliptical shape, the characteristic shape a galaxy assumes after forming from a merger of spiral galaxies. Some star formation is still taking place in NGC 3801, as shown in the ultraviolet by the Galaxy Evolution Explorer (colored blue), and in the dusty disk revealed in infrared light by NASA's Spitzer Space Telescope (red).

According to theory, that lingering star formation will soon be quenched by shock waves from two powerful jets shooting out of NGC 3801's central giant black hole. Radio emissions from those jets appear in this image in green. Like a cosmic leaf blower, the jets' expanding shock waves will blast away the remaining cool star-making gas in NGC 3801. The galaxy will become "red and dead," as astronomers say, full of old, red stars and lacking in any new stellar younglings.

Near-ultraviolet light from the Galaxy Evolution Explorer at a wavelength of 230 nanometers is rendered in blue, while visible light at 469 nanometers from Sloan is displayed in yellow. Infrared light at 8 microns from Spitzer is red, and radio emission at 20 centimeters from NRAO’s Very Large Array is overlaid in green.

Photo credit: NASA/JPL-Caltech/SDSS/NRAO/ASIAA

Note: For more information, see PIA15419: The Beginning of the End of Star Formation. Also, Cosmic 'Leaf Blower' Robs Galaxy of Star-Making Fuel.

Saturday, March 24, 2012

Abell 383


Abell 383: A cluster of galaxies located about 2.3 billion light years from Earth.

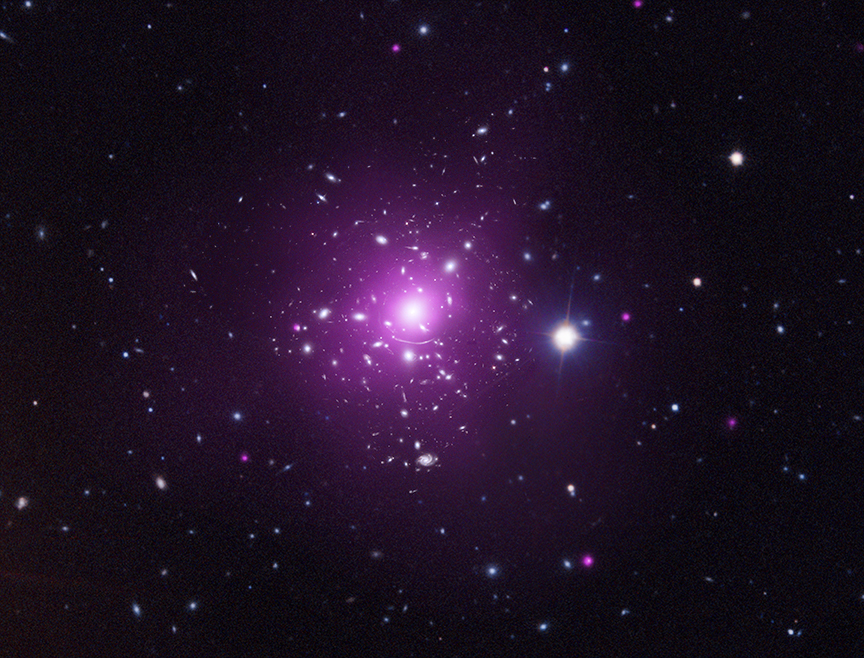
Two teams of astronomers have used data from Chandra and other telescopes to map the distribution of dark matter in three dimensions in the galaxy cluster Abell 383. The dark matter in Abell 383 is stretched out like a gigantic football with the point of the football aligned close to the line of sight. The X-ray data (purple) from Chandra in the composite image show the hot gas, which is by far the dominant type of normal matter in the cluster. Galaxies are shown with the optical data from the Hubble, the Very Large Telescope, and the Sloan Digital Sky Survey, colored in blue and white.

Scale: Image is 7.26 arcmin across. (4.84 million light years across.)

Photo credit: X-ray: NASA/CXC/Caltech/A.Newman et al/Tel Aviv/A.Morandi & M.Limousin; Optical: NASA/STScI, ESO/VLT, SDSS

Note: For more information, see Abell 383: Getting a Full Picture of an Elusive Subject.

Monday, October 24, 2011

The Bolshoi Simulation


The Bolshoi simulation is the most accurate cosmological simulation of the evolution of the large-scale structure of the universe yet made (“bolshoi” is the Russian word for “great” or “grand”). The first two of a series of research papers describing Bolshoi and its implications have been accepted for publication in the Astrophysical Journal. The first data release of Bolshoi outputs, including output from Bolshoi and also the BigBolshoi or MultiDark simulation of a volume 64 times bigger than Bolshoi, has just been made publicly available to the world’s astronomers and astrophysicists.

The starting point for Bolshoi was the best ground- and space-based observations, including NASA’s long-running and highly successful WMAP Explorer mission that has been mapping the light of the Big Bang in the entire sky. One of the world's fastest supercomputers then calculated the evolution of a typical region of the universe a billion light years across. The Bolshoi simulation took 6 million cpu hours to run on the Pleiades supercomputer—recently ranked as seventh fastest of the world’s top 500 supercomputers—at NASA Ames Research Center.

Large cosmological simulations such as the Millennium simulation are now the basis for much current research on the structure of the universe and the evolution of galaxies and clusters of galaxies. Due to significant advances in the measurement of the cosmological parameters and in the power and speed of supercomputers and simulation codes over the past half-decade since the Millennium cosmological simulation, the Bolshoi simulation is substantially better in resolution and accuracy. The Principal Investigators of the Bolshoi project, Anatoly Klypin and Joel Primack, and their colleagues anticipate that Bolshoi will become cosmology’s new benchmark simulation for making theoretical predictions that can then be tested against data gathered by observational astronomers. One of the first such predictions was the fraction of Milky Way-type galaxies with satellite galaxies as bright as our galaxy's Large and Small Magellanic Clouds; the results were in excellent agreement with observations from the Sloan Digital Sky Survey.

Video credit: A. Klypin (NMSU), J. Primack (UCSC) et al., Chris Henze (NASA Ames), NASA's Pleiades Supercomputer

Wednesday, December 22, 2010

Abell 644 and SDSS J1021+131: How Often Do Giant Black Holes Become Hyperactive?


This two-panel graphic contains two composite images of galaxies used in a recent study of supermassive black holes. In each of the galaxies, data from NASA's Chandra X-ray Observatory are blue, and optical data from the Sloan Digital Sky Survey are shown in red, yellow and white. The galaxy on the left, Abell 644, is in the center of a galaxy cluster that lies about 920 million light years from Earth. On the right is an isolated, or "field," galaxy named SDSS J1021+1312, which is located about 1.1 billion light years away. At the center of both of these galaxies is a growing supermassive black hole, called an active galactic nucleus (AGN) by astronomers, which is pulling in large quantities of gas.

A newly published study from Chandra tells scientists how often the biggest black holes in field galaxies like SDSS J1021+1312 have been active over the last few billion years. This has important implications for how environment affects black hole growth. The scientists found that only about one percent of field galaxies with masses similar to the Milky Way contain supermassive black holes in their most active phase. They also found that the most massive galaxies are the most likely to host these AGN, and that there is a gradual decline in the AGN fraction with cosmic time. Finally, the AGN fraction for field galaxies was found to be indistinguishable from that for galaxies in dense clusters, like Abell 644.

This study involves a survey called the Chandra Multiwavelength Project, or ChaMP, which covers 30 square degrees on the sky, the largest area covered of any Chandra survey to date. Combining Chandra's X-ray images with optical images from the Sloan Digital Sky Survey, about 100,000 galaxies were analyzed. Out of those, about 1,600 were bright in X-ray light, signaling possible AGN activity.

Photo credit: X-ray: NASA/CXC/Northwestern Univ/D.Haggard et al, Optical: SDSS

Wednesday, October 20, 2010

The Coma Cluster: Planck vs. Rosat


These images of the Coma cluster (also known as Abell 1656), a very hot and nearby cluster of galaxies, show how it appears through the Sunyaev-Zel'dovich Effect (top left) and X-ray emission (top right).

The top-left panel shows the Sunyaev-Zel'dovich image of the Coma cluster produced by Planck, and the top-right panel shows the same cluster imaged in X-rays by the ROSAT satellite. The colors in both images map the intensity of the measured signals. The X-ray contours are also superimposed on the Planck image as a visual aid.

As a comparison, the images are shown superimposed on a wide-field optical image of the Coma cluster from the Digitized Sky Survey in the two lower panels.

Located at a distance of about 300 million light-years from us, the Coma cluster extends over more than two degrees on the sky, corresponding to over 4 times the angular size of the full Moon. This image of the Coma cluster highlights Planck's ability to observe objects on very large scales, thanks to its all-sky survey strategy.

The region depicted in each image is slightly larger than 2 degrees.

Photo credits: Planck image: ESA/ LFI & HFI Consortia; ROSAT image: Max-Planck-Institut für extraterrestrische Physik; DSS image: NASA, ESA, and the Digitized Sky Survey 2. Acknowledgment: Davide De Martin (ESA/Hubble)

Tuesday, October 19, 2010

Large-Scale Structure of the Universe


This illustration depicts the large-scale distribution of galaxies as seen by the Sloan Digital Sky Survey, an ambitious project that determined the distances of about one million galaxies.

The two cones on the left of the image are a three dimensional (3D) map of the galaxies with the Earth at the center. Going from the center to the upper/lower edges of the map, more and more distant galaxies are seen, up to distances of about 2 thousand million [billion] light years. The color of the galaxies is related to their luminosity. The clumpiness in the distribution of matter is clearly visible in this representation.

The panel on the right shows a two dimensional (2D) image of galaxies in a small region of the sky. The 3D map is computed by combining the information contained in 2D images such as this one with an estimate of the distances of each individual object visible in it, derived from their spectra.

Illustration credit: Sloan Digital Sky Survey Team, NASA, NSF, DOE

Saturday, June 19, 2010

Ultraviolet Tail of IC 3418


NASA's Galaxy Evolution Explorer found a tail behind a galaxy called IC 3418. The star-studded tail can be seen on the left, as detected by the space telescope in ultraviolet light. The tail has escaped detection in visible light, as shown by the image on the right, taken by a visible-light telescope on the ground. This tail was created as the galaxy plunged into gas in a family of galaxies known as the Virgo cluster.

The image on the left is a composite of data from the Galaxy Evolution Explorer (far-ultraviolet light is dark blue and near-ultraviolet light is light blue); and the Sloan Digital Sky Survey (visible light is colored green and red). The image on the right is from the Sloan Digital Sky Survey.

Other galaxies and stars can be seen scattered throughout the image. Another galaxy called IC 3413, which is part of the Virgo cluster, can be seen to the right of IC 3418 as an oval-shaped blob. The bright large dot at upper right is a star in our Milky Way galaxy.

Photo credit: NASA/JPL-Caltech

Note: For more information, see Astronomers Discover Star-Studded Galaxy Tail.

Wednesday, June 16, 2010

Comet 65/P Gunn


This image from NASA's Wide-field Infrared Survey Explorer (WISE) features Comet 65/P Gunn. Comets are balls of dust and ice left over from the formation of the solar system. As a comet approaches the sun, it is heated and releases gas and dust from its surface, which are blown back by the solar wind into a long, spectacular tail. Comet 65/P Gunn's tail is seen here in red trailing off to the right of the comet's nucleus (near the center of the image).

Comet 65/P Gunn was discovered by James Gunn, a professor at Princeton University, N.J., in 1970. Gunn is the project scientist for the Sloan Digital Sky Survey, another important survey of the sky done in visible light. WISE observed the comet on April 24, 2010, in the constellation Capricornus (just one month after the comet's closest approach to the sun). This is a single-frame observation, covering an area of 1.5 by 1.5 full moons (0.76 by 0.76 degrees).

Comet 65/P Gunn is what is called a short-period comet. It orbits the sun inside the main asteroid belt between the orbits of the planets Mars and Jupiter. The orbit of 65/P Gunn is relatively round compared to many comets, and it takes 6.79 years to complete one trip around the sun. At the time that this image was taken, the comet was at a distance from Earth of 392 million kilometers (243 million miles). For reference, the average distance between the Sun and Earth is 150 million kilometers (93 million miles). The comet's speed relative the sun, when this picture was snapped, was about a whopping 7,700 kilometers per hour (4,800 miles per hour).

Just ahead of the comet is an interesting fuzzy red feature that makes it look something like a swordfish, or narwhal. This "sword," or dust trail, is made of dust particles that have previously been shed by 65/P Gunn as it orbits the sun. The dust is warmed by sunlight and glows in infrared light. Dust trails like this one often can encircle the sun, following the orbital path of the comet that produced it. If a dust trail crosses the orbit of Earth, then a meteor shower can occur as Earth passes through the debris cloud. Most of the particles in a dust trail are only about 0.1 millimeters in size. Comet 65/P Gunn's dust trail is out in the main asteroid belt, so Earth will never pass through it.

Also visible in this image are several asteroids -- chunks of rock and metal leftover from the formation of the solar system -- all of which orbit the sun in the main asteroid belt. Asteroids are much cooler than stars and appear red in this image. The most prominent asteroids in the image are: 2661 Bydzovsky; 89825; 76826; E4813; and 2007 VG119.

WISE sees invisible infrared light, and all four infrared detectors aboard WISE were used to make this image. The colors are representational. In this image, 3.4-micron light is colored blue; 4.6-micron light is green; 12-micron light is orange; and 22-micron light is red. Bluer objects in this image are warmer in temperature, such as stars, while cooler objects, such as asteroids and the comet, are redder in appearance.

Photo credit: NASA/JPL-Caltech/UCLA

Tuesday, April 27, 2010

Evolution of the Hubble Sequence


This image created from data taken from both the NASA/ESA Hubble Space Telescope and the Sloan Digital Sky Survey demonstrates that the Hubble sequence six thousand million years ago was very different from the one that astronomers see today. The two sections show how many more peculiar shaped galaxies (marked Pec) are seen among distant galaxies, as opposed to among local galaxies. The data organization follows the Hubble tuning-fork classification scheme invented in 1926 by the same Edwin Hubble in whose honor the space telescope is named.

The top image represents the current - or local - Universe. Using their sample, researchers found that 3 percent of galaxies were elliptical (marked E), 15 percent lenticular (marked S0), 72 percent spiral (marked Sa to Sd, or SBb to SBd) and 10 percent peculiar (marked Pec).

The bottom image represents the make up of the distant galaxies (six thousand million years ago), showing a much larger fraction of peculiar galaxies. The census found 4 percent of distant galaxies were elliptical, 13 percent lenticular (S0), 31 percent spiral and 52 percent peculiar. This implies that many of the peculiar galaxies ultimately become large spirals. According to the "spiral rebuilding" hypothesis, devised by the astronomers François Hammer, Rodney Delgado-Serrano and their group, this is due to the large number of major, gas-rich galaxy mergers between galaxies that were previously labeled "peculiar" in the distant Universe. It is thought that the large Andromeda galaxy from our neighborhood formed in this manner.

In total, 116 local galaxies and 148 distant galaxies were sampled. Spiral galaxies are further classified by labels that characterize their appearance; for example, an SBd galaxy means that it is a spiral galaxy that has slightly looser "arms" than an SBa galaxy and a less prominent bulge.

These images were created from data that are part of large sky surveys undertaken by the NASA/ESA Hubble Space Telescope and the 2.5-meter telescope at Apache Point Observatory, New Mexico, USA (Sloan Digital Sky Survey).

Image credit: NASA, ESA, Sloan Digital Sky Survey, R. Delgado-Serrano and F. Hammer (Observatoire de Paris)