Pages

Thursday, May 13, 2010

Galactic Metropolis


A surprisingly large collection of galaxies (red dots in center) stand out at a remarkably large distance in this composite image combining infrared and visible-light observations. NASA's Spitzer Space Telescope contributed to the infrared component of the observations, while shorter-wavelength infrared and visible data are provided by Japan's Subaru telescope atop Mauna Kea, Hawaii.

Looking out to this distance, the cluster appears as it was 9.6 billion years ago, only about three billion years after the Big Bang. Astronomers were surprised to find such a "modern" cluster at an era when its peers tended to be much smaller, presumably taking billions of more years to collect enough galaxies to reach such a size.

Infrared light from Spitzer at wavelengths of 3.6 and 4.5 microns is displayed in red. Subaru observations of near infrared and visible light with wavelengths of 0.9 and 0.44 microns are rendered in green and blue, respectively. The purple overlay is a calculated measure of overall galaxy density and highlights the high concentration of galaxies in the distant cluster.

Photo credit: NASA/JPL-Caltech/Subaru

Wednesday, May 12, 2010

Herschel Crater on Mimas


Subtle color differences on Saturn's moon Mimas are apparent in this false-color view of Herschel Crater captured by NASA's Cassini spacecraft during its closest-ever flyby of that moon.

The image shows terrain-dependent color variations, particularly the contrast between the bluish materials in and around Herschel Crater (130 kilometers, or 80 miles, wide) and the greenish cast on older, more heavily cratered terrain elsewhere. The origin of the color differences is not yet understood, but may be caused by subtle differences in the surface composition between the two terrains. False color images from Cassini's previous closest encounter, in 2005, also showed such variations (see PIA06257).

Herschel Crater covers most of the bottom of this image. To create this false-color view, ultraviolet, green and infrared images were combined into a single picture that exaggerates the color differences of terrain on the moon. These data were combined with a high-resolution image taken in visible light to provide the high-resolution information from the clear-filter image and the color information from the ultraviolet, green and infrared filter images.

The natural color of Mimas visible to the human eye may be a uniform gray or yellow color, but this mosaic has been contrast-enhanced and shows differences at other wavelengths of light.

During its closest-ever flyby on Feb. 13, 2010, Cassini came within about 9,500 kilometers (5,900 miles) of Mimas. This view looks toward the northern part of the hemisphere of Mimas that leads in the moon's orbit around Saturn. Mimas is 396 kilometers (246 miles) across. North on Mimas is up and rotated 12 degrees to the left.

The images were obtained with Cassini's narrow-angle camera on that day at a distance of approximately 16,000 kilometers (10,000 miles) from Mimas. The images were re-projected into an orthographic map projection. A black and white image, taken in visible light with the wide-angle camera, is used to fill in parts of the mosaic. Image scale is 90 meters (195 feet) per pixel.

Photo credit: NASA/JPL/Space Science Institute

Note: The Minister dislikes using the same photo that Astronomy Picture of the Day uses, especially on the same day! However, the Minister finds this picture of Herschel Crater so wonderful, that he can't help but to highlight this photo as soon as possible!

Tuesday, May 11, 2010

Bursting with Stars


This image is taken looking towards a region of our Milky Way galaxy in the Eagle constellation, closer to the galactic center than our sun. Here, we see the outstanding end products of the stellar assembly line. At the center and the left of the image, the two massive star-forming regions G29.9 and W43 are clearly visible. These mini-starbursts are forming, as we speak, hundreds and hundreds of stars of all sizes: from those similar to our sun, to monsters several tens of times heavier than our sun.

These newborn large stars are catastrophically disrupting their original gas embryos by kicking away their surroundings and excavating giant cavities in the galaxy. This is clearly visible in the "fluffy chimney" below W43.

Photo credit: ESA/Hi-GAL Consortium

Monday, May 10, 2010

Mare Frigoris


The floor of a l.2-km diameter crater in the Mare Frigoris Constellation region of interest. Samples of this material could help us understand the complex geologic history of this region of the Moon. NAC image M126752534RE; scene width is 510 m.

Samples from small, relatively fresh craters like the one above may someday help us learn more about Mare Frigoris [the Cold Sea] and its place in lunar geologic history. Mare Frigoris is located on the lunar nearside, to the north of the Imbrium and Serenitatis basins. Instead of being low in reflectance like typical mare basalts, its reflectance is intermediate between the mare to the south and highlands terrain to the north. This is likely due to a lower iron and titanium content than any of the sampled mare basalts, making it an intriguing end-member in the spectrum of lunar mare volcanism.

Portions of Mare Frigoris, like the area near the Constellation region of interest outlined below, are so high in reflectance they're considered "light plains." Light plains can form in several different ways: through volcanism, with a composition even lower in iron and titanium; as the result of impact basin ejecta, which acts as a fluid, filling in topographic lows; or as ancient volcanic plains that were subsequently covered with a thin layer of highlands material ejected from nearby craters or basins which masks the true basaltic surface (a hidden, or "cryptomare"). Small craters like the one above excavate material from below the surface, and can help discern whether or not the material there is distinct in composition (as would be expected for cryptomare). Sampling this material would provide a definitive resolution to the geologic history of this fascinating region.

Photo credit: NASA/GSFC/Arizona State University

Sunday, May 9, 2010

Menkhib and NGC 1499, the California Nebula, by WISE


This infrared image from NASA's WISE (Wide-field Infrared Survey Explorer) features one of the bright stars in the constellation Perseus, named Menkhib (the bright star in the upper left near the red dust cloud) along with a large star forming cloud cataloged as NGC 1499, or more commonly called the California Nebula (running diagonally through the image).

Menkhib [Xi Persei] is one of the hottest stars visible in the night sky; its surface temperature is about 37,000 Kelvin (about 66,000 degrees Fahrenheit -- over 6 times hotter than the Sun). Because of its high temperature it appears blue-white to the human eye (almost all stars appear bluish to WISE). It has about 40 times the mass of the Sun and gives off 330,000 times the amount of light. Menkhib is a runaway star, and the fast stellar wind it blows is piling up in front of it to create a shock wave in the gas and dust surrounding it in the space between the stars. This shock wave is heating up the dust within and WISE sees it as the red cloud in the upper left of the image.

Menkhib is part of an association of very hot stars that were born from the California Nebula only a few million years ago. These stars are lighting up the nebula; heating and ionizing it. In visible light, the ionized gas glows red, while in infrared light we see the heated dust (which appears in green and red in this image from WISE). The California Nebula gets its name due to a resemblance to the shape of the U.S. State of California (which you can just make out as outlined by the green dust if you rotate the image by a little more than 90 degrees clockwise). The entire California Nebula stretches across about 100 light-years, and we see about 80% of it in this view.

Menkhib and the California Nebula are about 1,800 light-years away from Earth. This is within the same spur of the Orion spiral arm of the Milky Way in which we are located.

All four infrared detectors aboard WISE were used to make this image. Color is representational: blue and cyan represent infrared light at wavelengths of 3.4 and 4.6 microns, which is dominated by light from stars. Green and red represent light at 12 and 22 microns, which is mostly light from warm dust.

Photo credit: NASA/JPL-Caltech/UCLA

Saturday, May 8, 2010

Odysseus Crater on Tethys, by Cassini


A huge impact created Odysseus Crater, which covers a large part of Saturn's moon Tethys in this Cassini spacecraft image.

Odysseus Crater is 450 kilometers (280 miles) across. This view looks toward the leading hemisphere of Tethys (1,062 kilometers, or 660 miles across). North on Tethys is up and rotated 3 degrees to the left.

The image was taken in visible light with the Cassini spacecraft narrow-angle camera on Jan. 27, 2010. The view was obtained at a distance of approximately 703,000 kilometers (437,000 miles) from Tethys and at a Sun-Tethys-spacecraft, or phase, angle of 79 degrees. Image scale is 4 kilometers (2 miles) per pixel.

Photo credit: NASA/JPL/Space Science Institute

Friday, May 7, 2010

HII Region RCW 120 by Herschel


A Herschel image of the HII region RCW 120, highlighting the newly detected young stars at the borders of the ionizing bubble. The massive protostar, with mass 8-10 times that of the Sun is visible on the lower edge of the bubble, to the right. This color-composite image combines observations at wavelengths of 100 µm (red; PACS), 160 µm (green; PACS) and 250 µm (blue; SPIRE).

Photo credit: ESA, PACS & SPIRE Consortia, A. Zavagno (Laboratoire d'Astrophysique de Marseille) for the Herschel HOBYS and Evolution of Interstellar Dust Key Programmes

Thursday, May 6, 2010

Central Peak of Copernicus Crater


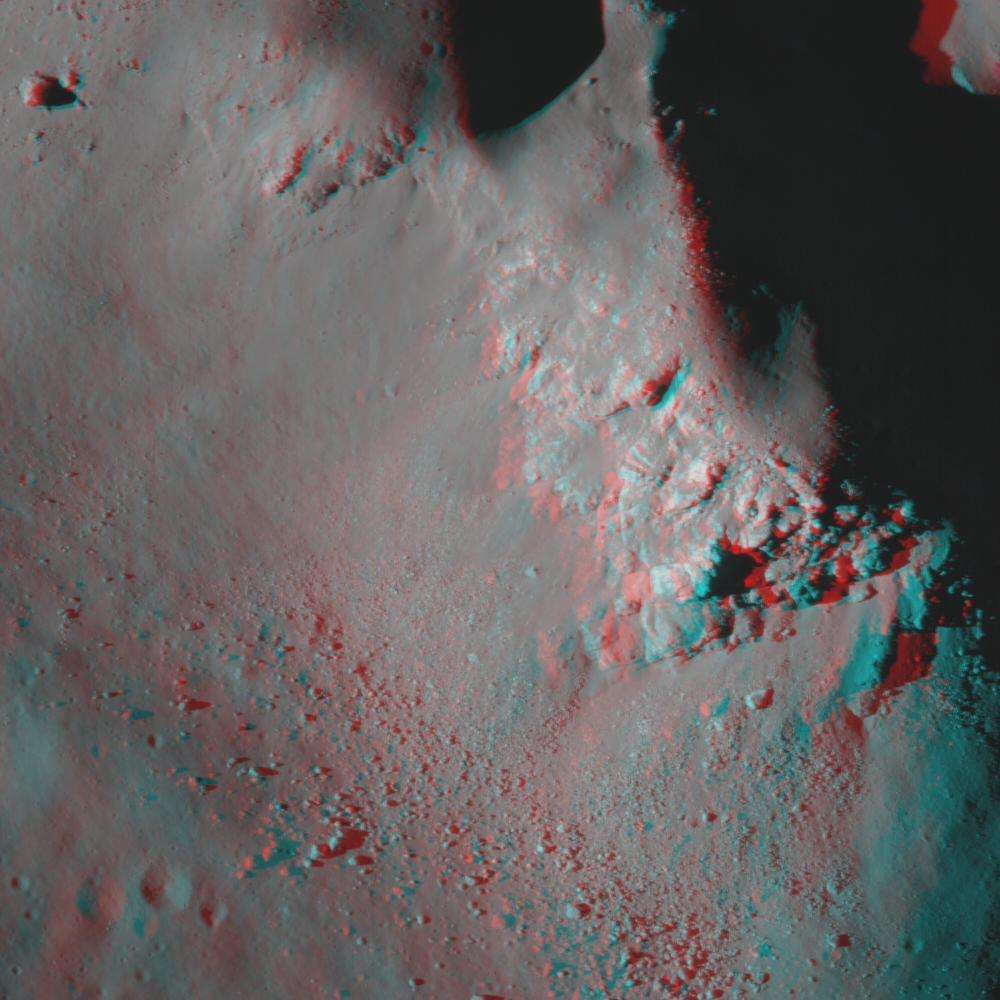
Today's LROC NAC image (M102293451) is a close up of the 93-km (58 miles) diameter Copernicus crater showing light-toned fractured bedrock exposed on the higher slopes on the central structural uplift. The bedrock observed in this NAC frame appears to be somewhat intact, and not a breccia (i.e., a rock consisting of a jumble of randomly oriented rock fragments). It is only slightly brecciated (or fragmented), which is consistent with the manner in which crater central peak rocks are uplifted and exposed. This location gives us a glimpse of bedrock that was protected beneath the surface until exposed by the Copernicus impact event and later landslides. Dark materials appear to fill fractures in this outcrop that may be highly shocked materials (e.g., impact melt or breccias) that were injected into the rock during the formation of Copernicus.

Photo credit: NASA/GSFC/Arizona State University

Note: For more information and photos (including an anaglyph), please see LROC: Central Peak of Copernicus Crater.

Wednesday, May 5, 2010

Hubble Pinpoints Distant Galaxies in Deepest View of Universe


This is the deepest image of the Universe ever taken in near-infrared light by the NASA/ESA Hubble Space Telescope. The faintest and reddest objects (left inset) in the image are galaxies that correspond to lookback times of approximately 12.9 billion years to 13.1 billion years. No galaxies have been seen before at such early epochs. These galaxies are much smaller than the Milky Way galaxy and have populations of stars that are intrinsically very blue. This may indicate the galaxies are so primordial that they are deficient in the heavier elements, and as a result, are quite free of the dust that reddens light through scattering.

The image was taken with Hubble's newly installed Wide Field Camera 3 (WFC3), which collects light from near-infrared wavelengths and therefore looks even deeper into the Universe. The light from very distant galaxies is stretched out of the ultraviolet and visible regions of the spectrum into near-infrared wavelengths by the expansion of the Universe.

Hubble's WFC3 took this image in late August 2009 during a total of four days of pointing for 173,000 seconds [i.e., 48 hours] of exposure time. Infrared light is invisible and therefore does not have colors that can be perceived by the human eye. The colors in the image are assigned comparatively to short, medium and long near-infrared wavelengths (blue, 1.05 microns; green, 1.25 microns; and red, 1.6 microns). The representation is "natural" in that shorter wavelengths appear blue while longer wavelengths are redder. The faintest objects are about one-billionth as bright as can be seen with the naked eye. The galaxy distances are estimated from the infrared colors of their light.

Photo credit: NASA, ESA, G. Illingworth (UCO/Lick Observatory and University of California, Santa Cruz) and the HUDF09 Team

Tuesday, May 4, 2010

Dione Passing by Tethys


Saturn's moon Dione passes by the moon Tethys in this Cassini spacecraft depiction of a "mutual event." Mutual events occur when, from the vantage point of Cassini, one moon appears to pass close to or in front of another moon.

Mutual event observations help scientists refine their understanding of the orbits of Saturn's moons. See PIA11692 to watch a movie of a mutual event. Lit terrain seen here is on Saturn-facing, trailing hemisphere side of both Tethys (1,062 kilometers, or 660 miles across) and Dione (1,123 kilometers, or 698 miles across).

The image was taken in visible green light with the Cassini spacecraft narrow-angle camera on March 26, 2010. The view was obtained at a distance of approximately 2 million kilometers (1.2 million miles) from Dione and 2.4 million kilometers (1.5 million miles) from Tethys. Image scale in the original image was 12 kilometers (7 miles) per pixel on Dione and 14 kilometers (9 miles) per pixel on Tethys. The image was contrast enhanced and magnified by a factor of two to enhance the visibility of surface features.

Photo credit: NASA/JPL/Space Science Institute

Monday, May 3, 2010

NGC 2359, Thor's Helmet, by WISE


This heroic image from WISE is of a special cloud of dust and gas in the constellation Canis Major cataloged as NGC 2359. The nebula is more commonly known as Thor's Helmet due to its remarkable resemblance to depictions of the headwear donned by the famed Norse god of thunder and lightning.

Powering Thor's Helmet is HD 56925, a highly luminous "Wolf-Rayet" star (seen at the center of the helmet). These kinds of stars are massive; from 10 to 80 times the mass of our Sun. Such stars are often associated with bright nebulae, many of which appear to be spherical bubbles with the Wolf-Rayet star at the center. It is thought that the progenitors of these stars are either red supergiants or luminous blue variable stars, both of which slowly shed matter as they age. Once the star enters its Wolf-Rayet phase its strong, fast stellar wind sweeps up the surrounding debris left by the original star and even gathers up interstellar matter from its environment. It literally blows a bubble in space. These hot stars become 200,000 times more luminous than the Sun. They flood the nebula with ultraviolet light that ionizes much of the gaseous material leading to the bright emission in visible light. Interactions with a nearby large molecular cloud are thought to have contributed to the more complex shape and curved bow-shock structure of Thor's Helmet.

NGC 2359 was the first Wolf-Rayet nebula to be discovered. Between 1917 and 1919, Francis Pease studied the nebula at the Mt. Wilson observatory in southern California. He described the bright regions of the nebula as matching the descriptions of early observers such as Sir John Herschel (son of the discoverer of infrared light, William Herschel), who saw a bust rather than a helmet. The object was later found to show nitrogen emission by Edwin Hubble and listed in his 1922 paper, "A General Study of Diffuse Galactic Nebulae." The object has also been of interest to members of the WISE science team during their careers having been studied by Martin Cohen and the WISE Principal Investigator Ned Wright, who co-authored an article in the March 1980 issue of Sky & Telescope, "A Bubble in Space - The Shell of NGC 2359."

Thor's Helmet is about 30 light-years across and its distance from Earth is estimated to be about 15,000 light-years. This image covers an area of sky about 2.5 times the size of the full Moon. All four infrared detectors aboard WISE were used to make this image. Color is representational: blue and cyan represent infrared light at wavelengths of 3.4 and 4.6 microns, which is dominated by light from stars. Green and red represent light at 12 and 22 microns, which is mostly light from warm dust.

Photo credit: NASA/JPL-Caltech/UCLA

Saturday, May 1, 2010

Messier 31 - The Andromeda Galaxy - by Swift


NASA's Swift satellite has acquired the highest-resolution view of the neighboring spiral galaxy M31. Also known as the Andromeda Galaxy, M31 is the largest and closest such galaxy to our own. It's more than 220,000 light-years across and lies 2.5 million light-years away in the constellation Andromeda. Between May 25 and July 26, 2008, Swift's Ultraviolet/Optical Telescope (UVOT) acquired 330 images of M31 at wavelengths of 192.8, 224.6, and 260 nanometers. The images represent a total exposure time of 24 hours. Some 20,000 ultraviolet sources are visible in the image, including M32, a small galaxy in orbit around M31. Dense clusters of hot, young, blue stars sparkle in the disk beyond the galaxy's smooth, redder central bulge. Star clusters are especially plentiful along a ring about 150,000 light-years across.

For more information, see Swift Makes Best-ever Ultraviolet Portrait of Andromeda Galaxy.

Friday, April 30, 2010

Copland Crater


Visible in the center of this image is the crater Copland, recently named in honor of the American composer and pianist Aaron Copland. Aaron Copland and this crater are both unquestionably worthy candidates for named features on Mercury, but how this specific crater came to be known as Copland has an interesting back-story.

Amateur astronomer Ronald Dantowitz and his colleagues Scott Teare and Marek Kozubal used the Mt. Wilson 60-inch telescope in 1998 to observe a very bright feature on this portion of Mercury's surface, and they assumed that the bright feature was an impact crater. Mr. Dantowitz expressed his wish that the crater be named "Copland" once better images of the area were obtained from spacecraft. Surprisingly, MESSENGER images from Mercury flyby 3 revealed that the small bright feature, seen at the left edge of this image, is not an impact crater but more closely resembles a volcanic vent. No convention for naming volcanic vents on Mercury has yet been adopted, because none were identified prior to MESSENGER's first Mercury flyby. However, even if a convention for naming volcanic features on Mercury is adopted in the future, the naming rules will likely differ from those for impact craters, and thus "Copland" would probably not be an acceptable name for the bright volcanic feature. A MESSENGER team member corresponded with Mr. Dantowitz and suggested that the name Copland be proposed instead for a large crater nearby. He agreed, and the International Astronomical Union (IAU) approved the name Copland on March 3, 2010.

Copland crater is flooded with volcanic smooth plains material that could be related to the activity that formed the bright vent.

Photo credit: NASA/Johns Hopkins University Applied Physics Laboratory/Carnegie Institution of Washington

Thursday, April 29, 2010

Woven Shadow


Part of the shadow of Saturn's moon Epimetheus appears as if it has been woven through the planet's rings in this Cassini image taken about a month and a half before the planet's August 2009 equinox.

Epimetheus itself is not shown, but the moon casts a shadow whose appearance varies based on the density of particles across the rings. See PIA11659 and PIA11660 to learn more.

The novel illumination geometry that accompanies equinox lowers the sun's angle to the ringplane, significantly darkens the rings, and causes out-of-plane structures to look anomalously bright and cast shadows across the rings. These scenes are possible only during the few months before and after Saturn's equinox, which occurs only once in about 15 Earth years. Before and after equinox, Cassini's cameras have spotted not only the predictable shadows of some of Saturn's moons (see PIA11657), but also the shadows of newly revealed vertical structures in the rings themselves (see PIA11665).

This view looks toward the northern, unilluminated side of the rings from about 45 degrees above the ringplane.

The image was taken in visible light with the Cassini spacecraft narrow-angle camera on June 26, 2009. The view was obtained at a distance of approximately 943,000 kilometers (586,000 miles) from Saturn. Image scale is 5 kilometers (3 miles) per pixel.

Photo credit: NASA/JPL/Space Science Institute

Wednesday, April 28, 2010

Planck's View of Orion


The big Hunter in the sky is seen in a new light by Planck, a European Space Agency mission with significant NASA participation. The long-wavelength image shows most of the constellation Orion, highlighting turbid clouds of cold material, where new stars are being stirred into existence.

This long-wavelength image covers a square region of 13 by 13 degrees (which is equivalent to 26 by 26 full moons). It is a three-color combination constructed from three of Planck's nine frequency channels: 30, 353 and 857 gigahertz.

The Planck mission is busy surveying the whole sky at longer wavelengths of light than we can see with our eyes, ranging from infrared to even longer-wavelength microwaves. It is collecting ancient light from the very beginning of time to learn more about the birth and fate of our universe. In the process, the mission is gathering data on our Milky Way galaxy that astronomers are using to see through cold pools of gas and dust, which block visible-light views of star formation.

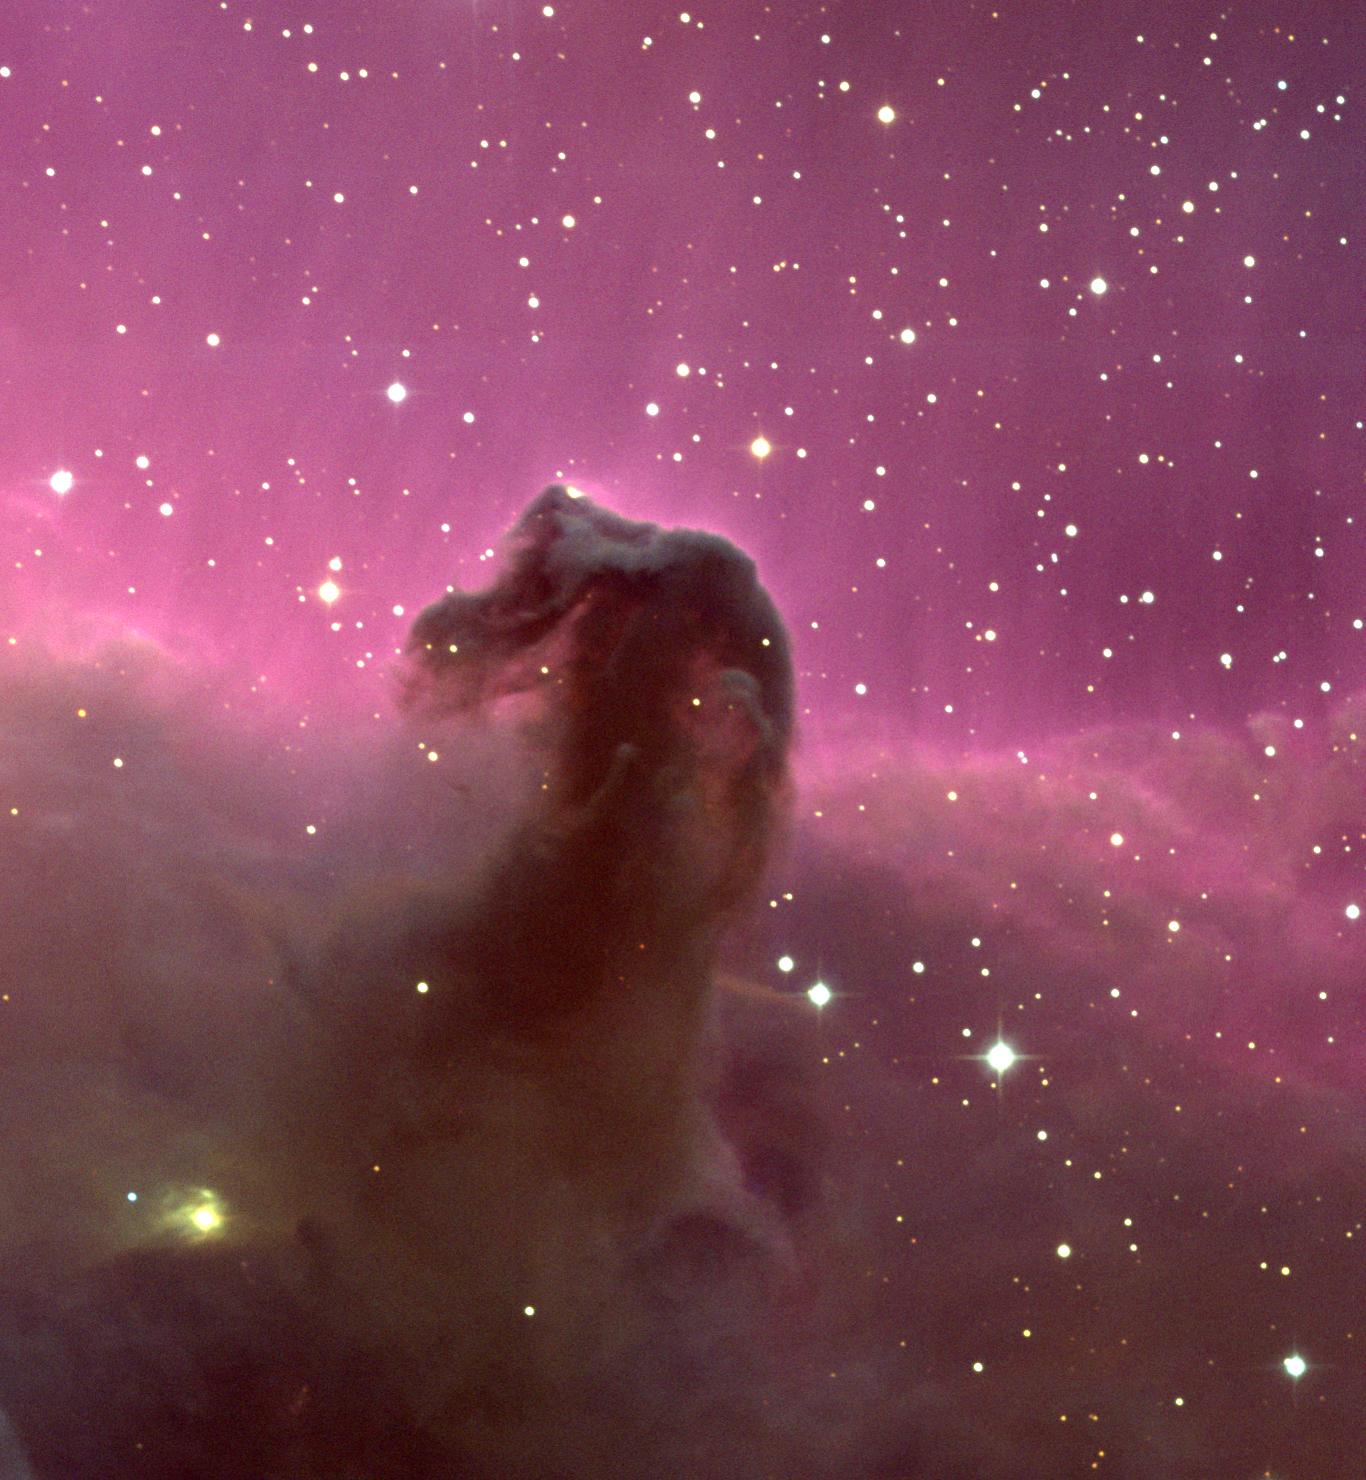
The image shows one such region in our Milky Way, where stars are actively bursting to life. The much-photographed Orion nebula is the bright spot to the lower center. The bright spot to the right of center is around the Horsehead Nebula, so called because at high magnifications a pillar of dust resembles a horse's head. The whole view covers a square patch of sky equivalent to 26 by 26 moons.

The giant red arc of Barnard's Loop is thought to be the blast wave from a star that blew up inside the region about two million years ago. The bubble it created is now about 300 light-years across.

Note: The below photo, from the Digitized Sky Survey, is of the same region of Orion.


Photo credits: (Planck) ESA/LFI & HFI Consortia; (Digitized Sky Survey) STScI DSS

Tuesday, April 27, 2010

Evolution of the Hubble Sequence


This image created from data taken from both the NASA/ESA Hubble Space Telescope and the Sloan Digital Sky Survey demonstrates that the Hubble sequence six thousand million years ago was very different from the one that astronomers see today. The two sections show how many more peculiar shaped galaxies (marked Pec) are seen among distant galaxies, as opposed to among local galaxies. The data organization follows the Hubble tuning-fork classification scheme invented in 1926 by the same Edwin Hubble in whose honor the space telescope is named.

The top image represents the current - or local - Universe. Using their sample, researchers found that 3 percent of galaxies were elliptical (marked E), 15 percent lenticular (marked S0), 72 percent spiral (marked Sa to Sd, or SBb to SBd) and 10 percent peculiar (marked Pec).

The bottom image represents the make up of the distant galaxies (six thousand million years ago), showing a much larger fraction of peculiar galaxies. The census found 4 percent of distant galaxies were elliptical, 13 percent lenticular (S0), 31 percent spiral and 52 percent peculiar. This implies that many of the peculiar galaxies ultimately become large spirals. According to the "spiral rebuilding" hypothesis, devised by the astronomers François Hammer, Rodney Delgado-Serrano and their group, this is due to the large number of major, gas-rich galaxy mergers between galaxies that were previously labeled "peculiar" in the distant Universe. It is thought that the large Andromeda galaxy from our neighborhood formed in this manner.

In total, 116 local galaxies and 148 distant galaxies were sampled. Spiral galaxies are further classified by labels that characterize their appearance; for example, an SBd galaxy means that it is a spiral galaxy that has slightly looser "arms" than an SBa galaxy and a less prominent bulge.

These images were created from data that are part of large sky surveys undertaken by the NASA/ESA Hubble Space Telescope and the 2.5-meter telescope at Apache Point Observatory, New Mexico, USA (Sloan Digital Sky Survey).

Image credit: NASA, ESA, Sloan Digital Sky Survey, R. Delgado-Serrano and F. Hammer (Observatoire de Paris)

Monday, April 26, 2010

Comparison Views of "Mystic Mountain"


These two images of a pillar of star birth, three light-years high, demonstrate how observations taken in visible and infrared light by the NASA/ESA Hubble Space Telescope reveal dramatically different and complementary views of an object. The pair of images demonstrates how Hubble's new panchromatic view of the Universe shows striking differences between visible and infrared wavelengths. This turbulent cosmic pinnacle lies within a tempestuous stellar nursery called the Carina Nebula, located 7500 light-years away in the southern constellation of Carina. The images mark the 20th anniversary of Hubble's launch and deployment into an orbit around Earth.

[Left] This visible-light view shows how scorching radiation and fast winds (streams of charged particles) from super-hot newborn stars in the nebula are shaping and compressing the pillar, causing new stars to form within it. Infant stars buried inside fire off jets of gas that can be seen streaming from towering peaks. Streamers of hot ionized gas can be seen flowing from the ridges of the structure, and wispy veils of gas and dust, illuminated by starlight, float around it.

The dense parts of the pillar are resisting being eroded by radiation. The colors in this composite image correspond to the glow of oxygen (blue), hydrogen and nitrogen (green), and sulfur (red).

[Right] This near-infrared image shows a myriad of stars behind the gaseous veil of the nebula's background wall of hydrogen, laced with dust. The foreground pillar becomes semi-transparent because infrared light from the background stars penetrates through much of the dust. A few stars inside the pillar also become visible. Representative colors are assigned to three different infrared wavelength ranges.

Hubble's Wide Field Camera 3 observed the pillar in February/March 2010.

Photo credit: NASA, ESA, M. Livio and the Hubble 20th Anniversary Team (STScI)

Update: Hah! First! :) The Minister is pleased with himself that he discussed "Mystic Mountain" before the editors of the esteemed Astronomy Picture of the Day (even if it was by a mere few hours). However, the Minister also suggests to his readers that they visit APOD for another great picture and more information on this beautiful nebula.

Sunday, April 25, 2010

Star Clusters and Nebulae


This colorful image from NASA's WISE (Wide-field Infrared Survey Explorer) is a view of an area of the sky over 12 times the size of the full Moon on the border of the constellations Sagittarius and Corona Australis. Two types of star clusters are visible in the image.

The wispy nebula running top to bottom of this image is a nearby star forming region. In visible light the dust within the nebula obscures and reflects the light of the stars within and behind it, giving rise to several cataloged nebula (NGC 6726, NGC 6727, NGC 6729, IC 4812). But here in infrared light we see the light of the dust itself as it is warmed by the light of the newborn stars in the cluster (green and red). We also see through the dust to peer at the stars nestled within (blue/cyan). This star cluster has been called the Coronet Cluster. It is located some 420 light-years from Earth, and stretches about 10 light-years across. The Coronet Cluster is a relatively loose cluster of only a few dozen stars, many of which are only a few million years old.

Just to the left of center is a very different kind of star cluster. NGC 6723 is a globular star cluster located some 29,000 light-years away from Earth, and spans about 65 light-years in size. Globular star clusters contain hundreds of thousands to millions of stars and orbit around the Galaxy in a spherical halo surrounding it. These are some of the oldest stars in the Universe, over 10 billion years old.

All four infrared detectors aboard WISE were used to make this image. Color is representational: blue and cyan represent infrared light at wavelengths of 3.4 and 4.6 microns, which is dominated by light from stars. Green and red represent light at 12 and 22 microns, which is mostly light from warm dust.

Photo credit: NASA/JPL-Caltech/UCLA


Note: I've added this annotated photograph of the area to help people identify the different nebulae and star clusters in the photograph.

Photo credit: Loke Kun Tan (StarryScapes)

Saturday, April 24, 2010

Methane-Free Exoplanet GJ 436b


An unusual, methane-free world is partially eclipsed by its star in this artist's concept. NASA's Spitzer Space Telescope has found evidence that a hot, Neptune-sized planet orbiting a star beyond our sun lacks methane -- an ingredient common to many planets in our own solar system.

Models of planetary atmospheres indicate that any world with the common mix of hydrogen, carbon and oxygen, and a temperature up to 1,000 Kelvin (1,340 degrees Fahrenheit) should have a large amount of methane and a small amount of carbon monoxide.

The planet illustrated here, called GJ 436b is about 800 Kelvin (or 980 degrees Fahrenheit) -- it was expected to have methane but Spitzer's observations showed it does not.

The finding demonstrates the diversity of exoplanets, and indicates that models of exoplanetary atmospheres need to be revised.


How to Measure Exoplanet Light

The plots in Figure 1 show light from the distant planet, GJ 436b, and its star, as measured at six different infrared wavelengths. Astronomers use telescopes like Spitzer to measure the direct light of distant worlds, called exoplanets, and learn more about chemicals in their atmospheres.

The technique involves measuring light from an exoplanet and its star before, during and after the planet circles behind the star. (The technique only works for those planets that happen to cross behind and in front of their stars as seen from our point of view on Earth.) When the planet disappears behind the star, the total light observed drops, as seen by the dips in these light curves. This same measurement is repeated at different wavelengths of light. In this graph, the different wavelengths are on the vertical axis, and time on the horizontal axis. Those dips in the total light tell astronomers exactly how much light is coming from the planet itself.

As the data demonstrate, the amount of light coming off a planet changes with different wavelengths. The differences are due to the temperature of a planet as well as its chemical makeup. In this case, astronomers were able to show that GJ 436b lacks the common planetary ingredient of methane.

Image credit: NASA/JPL-Caltech

Friday, April 23, 2010

Dante Crater


Highlands terrain inside the Dante Crater Constellation Site. A portion of LROC NAC image M121044107R, 580 m across.

Only a handful of humans have ever seen the farside of the Moon. In the future, human explorers near Dante crater in the farside highlands will be searching for samples of the Moon's most ancient, primordial crust (anorthosites like the famous Apollo sample 15415). There was a time after the Moon's formation when the entire surface was covered by an ocean of magma; the upper layer of this magma ocean crystallized to form a global layer of anorthosite. Since that time, impacts and other geological processes have broken and churned the surface, but this area may posses significant amounts of these original rocks. Pristine lunar anorthosites are relatively rare in the Apollo sample collections; with enough samples we could learn when the primordial crust started to form and when it was complete. Scientists would also like to learn the rate of cratering during this early period in the Moon's formation. The ancient regolith contains rocks that formed from impact melt, which can be dated to learn when the impact even that created them occurred. Did the large impacts form across a broad range of time - or in one large spike? Collecting samples from this ancient highland area would help use better understand this early period in Solar System development, with profound implications for understanding the early history of Earth.


Portion of LROC WAC image M118668951M, which covers Dante Crater itself. The region of M121044107R (above) is to the west of this scene.

The Dante region has abundant aluminum and calcium-rich regolith that is available for in-situ resource utilization, allowing explorers to extend their stay in this region by processing the local materials to produce oxygen and fuel while building habitats and other structures.

Explorers at this location would never see the Earth. They would instead see the unobstructed vista of the Milky Way above them. The Sun would rise and set once a month, but all communications back to Earth would have to be via orbiting relay satellites. However, with the bulk of the Moon shielding this location from the bright lights and radio waves of the Earth, the central farside highlands are an optimal location for astronomy, especially observations of the low-frequency radio sky.

Photo credit: NASA/GSFC/Arizona State University

Thursday, April 22, 2010

Cleaning and Aluminizing the Hale Telescope Mirror

This is a fascinating time-lapse video (with narration) that shows the process of the cleaning and aluminizing of the Hale Telescope mirror, which is located at the Palomar Observatory. The mirror is first removed from the telescope and moved to the area inside the observatory where it will be cleaned. Near the end of the cleaning process, the old coat of aluminum is removed from the mirror, allowing one to see the honeycomb structure of the underside. When the mirror is ready, a new coat of aluminum is evaporated onto the glass.

Wednesday, April 21, 2010

The Belet Region of Titan


The Cassini spacecraft looks at Belet, a dark region on Saturn's largest moon, Titan.

This large region on the moon has a low albedo, meaning it diffusely reflects little light. See PIA11149 to learn more. This view looks toward the trailing hemisphere of Titan (5,150 kilometers, or 3,200 miles across). North on Titan is up and rotated 2 degrees to the right.

The image was taken with the Cassini spacecraft narrow-angle camera on Jan. 15, 2010 using a spectral filter sensitive to wavelengths of near-infrared light centered at 938 nanometers. The view was acquired at a distance of approximately 1.2 million kilometers (746,000 miles) from Titan and at a Sun-Titan-spacecraft, or phase, angle of 51 degrees. Image scale is 7 kilometers (4 miles) per pixel.

Photo credit: NASA/JPL/Space Science Institute

Tuesday, April 20, 2010

IC 1795 by WISE


This image from NASA's Wide-field Infrared Survey Explorer, or WISE, is a view within the constellation Cassiopeia of another portion of the vast star forming complex that makes up part of the Perseus spiral arm of the Milky Way Galaxy. Two of the previously released images from WISE are also a part of the same star formation complex of nebulae: The Soul Nebula (PIA13014) and Maffei 1 and 2 (PIA12865). A distinct star forming region is visible in the bottom right corner of this image, called IC 1795. Most of this region appears dark and relatively devoid of stars in photographs taken in visible light. This is because of the obscuring dust, but that same dust glows brightly in the infrared images obtained by WISE. The cloud is located just over 6,000 light-years away from Earth. Stars forming in this image are all relatively young, on the order of millions of years. That is young in comparison to stars like the Sun, which is nearly 5 billion years old.

This image covers an area of sky larger than 12 full Moons. All four infrared detectors aboard WISE were used to make this image. Color is representational: blue and cyan represent infrared light at wavelengths of 3.4 and 4.6 microns, which is dominated by light from stars. Green and red represent light at 12 and 22 microns, which is mostly light from warm dust.

Photo credit: NASA/JPL-Caltech/UCLA

Monday, April 19, 2010

The Apollo 15 Lunar Laser Ranging Retroreflector


The Apollo 15 Lunar Laser Ranging RetroReflector (LRRR) array is one of four such working arrays on the surface of the Moon. As the largest (105 x 65 cm in size) it serves as the primary target for laser ranging to the Moon. In this calibrated image it appears as the (circled) tiny white rectangular feature farthest to center left (near the edge of the original NAC image). The distance to these retroreflectors from the Earth can be and is still routinely measured to the centimeter level or better, and their relative positions are known to a similar level. Such measurements can be used for several purposes, such as precisely determining the orientation and orbit of the Moon, testing gravitation and general relativity theories, and for establishing a highly precise latitude and longitude coordinate frame for the Moon. The image width is 391 meters, with a pixel width of 52 cm. Subset of NAC frame M111578606LE [NASA/GSFC/Arizona State University].

The close-up here of the Apollo 15 landing site (26.1°N 3.6°E) is a portion of one of several LROC narrow angle camera (NAC) images that show the site (see earlier released image). Although near the edge of the NAC image M111578606LE, this close-up (about 391 meters across, at 52 cm/pixel) shows many pieces of hardware left on the surface by the Apollo 15 astronauts, including of interest here the Apollo 15 lunar Laser Ranging RetroReflector (LRRR) array. It was placed on the Moon by astronaut David Scott on 1971 July 31. A photograph of a portion of the LRRR taken by Scott is shown below. The Apollo 15 array is one of four usable such arrays on the Moon. The others are at the Apollo 11 and Apollo 14 sites, and on the Lunokhod 2 rover (see here for information on Lunokhod 2).


A portion of the Apollo 15 lunar laser ranging retroreflector array, as placed on the Moon and photographed by D. Scott [NASA photo AS15-85-11468].

Finding your position on the Moon can be tricky. Since the 17th century, the Moon's coordinates have been measured in what is now known as the “mean Earth/polar axis system,” or ME system for short. This is a latitude and longitude system where the mean (average) direction of the Earth over time defines the 0° longitude, or prime meridian, and the average direction of the Moon’s polar axis defines 90° north and south latitude. However, in order to effectively use such a system, it is necessary to assign latitude and longitude to a set of points on the Moon. This is where the LRRR arrays come in. Over the years since they were emplaced on the Moon, lunar laser ranging (LLR) observations of these arrays from several sites on the Earth have been processed and the relative positions of these arrays determined to the centimeter level. These relative coordinates have been converted to absolute latitude and longitude coordinates according to the above definition of the ME system, and thus are now the points on the Moon whose positions are most accurately known.

However, for the general purpose of locating things on the Moon, knowing the positions of only four points is not particularly useful. Therefore an important step in being able to use the data being returned from the LRO mission, as well as from previous U. S. and international missions, is to connect those datasets to the LLR coordinates. For LRO, a first step will be to determine the coordinates of LROC images and digital elevation models (DEMs) (see here) covering the LRRR sites). A second step will be to compare the positions of LRO Lunar Orbiter Laser Altimeter (LOLA) data to these images and DEMs in order to make sure that the global LOLA dataset is connected to these coordinates. The final step will be to assure that all other LROC and eventually even past U.S. and international mission data are in the same LLR coordinate frame. This will assure that lunar datasets will be in the same coordinate frame and that such data can be used together, consistently, for human exploration planning and associated science activities.

For more information on connecting lunar datasets together, read this 2010 Lunar and Planetary Science Conference abstract.

Explore the rest of the Apollo 15 landing site area!

Sunday, April 18, 2010

Stories and Photos of Interest

The Minister finds himself awash in an embarrassment of riches. Due to a tight schedule, he is only able to do one post per day for his MinSEx blog. Alas, the number of stories and photos that he might be able to blog about is a much greater number. Thus, he's going to provide a weekly list of some (but not all) of the stories and photos he's come across in the past week that he thinks his readers might find of interest. Sorted by topic:

The Sun:
Bright Points on the Quiet Sun (Recommended!)

Earth:
PIA13041: NASA's AIRS Instrument Captures Ash Cloud from Icelandic Volcano
PIA13046: NASA Satellite Images Provide Insights Into Iceland Volcanic Plume
PIA13033: Hale Telescope, Palomar Observatory

Moon:
PIA13039: Rimae Prinz Region - Constellation Region of Interest
PIA13038: Exposed Fractured Bedrock in the Central Peak of the Anaxagoras Crater

Saturn:
PIA12613: Brilliant Blip Beyond Saturn
PIA12579: Dione Polar Maps - February 2010
PIA12578: Dione Polar Maps - February 2010
PIA12577: Map of Dione - February 2010
PIA12612: In the Arc
PIA12576: Lightning Flashing on Saturn
PIA12575: First Lightning Flashes on Saturn
PIA12611: Up and Down Tethys
PIA12610: Lost Among Stars

Space Exploration:
A Large Space Station Over Earth
Damage to Apollo 13

Black Holes:
Diagnosis Murder: Study Shows Supermassive Black Holes May Strip Galaxies of Life

Galaxies:
NGC 4651: The Umbrella Galaxy
Explained: Why Many Surveys of Distant Galaxies Miss 90% of Their Targets

Palomar Observes the Exoplanets Around HR 8799


Note: I originally discussed the discovery of the three exoplanets orbiting around star HR 8799 back in November 2008 in my post Four Exoplanets Seen.

This image shows the light from three planets orbiting a star 120 light-years away. The planets' star, called HR8799, is located at the spot marked with an "X."

This picture was taken using a small, 1.5-meter (4.9-foot) portion of the Palomar Observatory's Hale Telescope, north of San Diego, California. This is the first time a picture of planets beyond our solar system has been captured using a telescope with a modest-sized mirror -- previous images were taken using larger telescopes.

The three planets, called HR8799b, c and d, are thought to be gas giants like Jupiter, but more massive. They orbit their host star at roughly 24, 38 and 68 times the distance between our Earth and sun, respectively (Jupiter resides at about 5 times the Earth-sun distance).

Photo credit: NASA/JPL-Caltech/Palomar Observatory