Pages

Friday, July 2, 2010

Voyager 2 at 12,000 Days


NASA's plucky Voyager 2 spacecraft has hit a long-haul operations milestone today (June 28) -- operating continuously for 12,000 days. For nearly 33 years, the venerable spacecraft has been returning data about the giant outer planets, and the characteristics and interaction of solar wind between and beyond the planets. Among its many findings, Voyager 2 discovered Neptune's Great Dark Spot and its 450-meter-per-second (1,000-mph) winds.

The two Voyager spacecraft have been the longest continuously operating spacecraft in deep space. Voyager 2 launched on August 20, 1977, when Jimmy Carter was president. Voyager 1 launched about two weeks later on September 5. The two spacecraft are the most distant human-made objects, out at the edge of the heliosphere -- the bubble the sun creates around the solar system. Mission managers expect Voyager 1 to leave our solar system and enter interstellar space in the next five years or so, with Voyager 2 on track to enter interstellar space shortly after that.

Having traveled more than 21 billion kilometers (13 billion miles) on its winding path through the planets toward interstellar space, the spacecraft is now nearly 14 billion kilometers (9 billion miles) from the sun. A signal from the ground, traveling at the speed of light, takes about 12.8 hours one-way to reach Voyager 2.

Voyager 1 will reach this 12,000-day milestone on July 13, 2010 after traveling more than 22 billion kilometers (14 billion miles). Voyager 1 is currently more than 17 billion kilometers (11 billion miles) from the sun.

Image Credit: NASA/JPL/California Institute of Technology

Thursday, July 1, 2010

Interstellar Dust in the Solar Sytem


The pictures above show cut-aways of where interstellar dust is concentrated in the Solar System - high concentration: red/yellow, low concentration: blue/green (the planets are not shown). During solar minimum (top picture) most interstellar dust can be found above or below the Sun, while at the solar maximum (bottom picture) the dust is concentrated close to the Sun in the plane of the planets' orbits.

Image credit: ESA

Note: At this time, the top image is what current conditions should look like in our solar system as the sun is just now starting to come out of its most recent solar minimum.

Wednesday, June 30, 2010

Messier 83


This image from the Wide-field Infrared Survey Explorer, or WISE, shows the nearby galaxy Messier 83, or M83 for short. This is a spiral galaxy approximately 15 million light-years away in the constellation Hydra. Sometimes referred to as the southern Pinwheel galaxy, M83 has a similar appearance to M101, the Pinwheel galaxy, but it is located in the southern sky. At about 55,500 light-years across, M83 is a bit more than half the size of our Milky Way galaxy, with a similar overall structure.

Like the Milky Way, most of M83's stars, dust and gas lie in a thin disk decorated with grand spiral arms. We see the disk of M83 nearly face-on (whereas we see the disk of the Milky Way edge-on since we are inside it). The spiral arms are places where the disk is a bit denser, with more stars and gas and higher rates of star formation. Where there is star formation, there are more very bright, short-lived stars, and plenty of dust (green and red in this infrared image).

M83 is referred to as a barred spiral galaxy, because its central bulge of stars and dust has a component that is roughly spherical, and a component that is shaped like a bar.

This image was made from observations by all four infrared detectors aboard WISE. Blue and cyan represent infrared light at wavelengths of 3.4 and 4.6 microns, which is primarily light from stars. Green and red represent light at 12 and 22 microns, which is primarily emission from warm dust.

Photo credit: NASA/JPL-Caltech/UCLA

Tuesday, June 29, 2010

Hydrated Minerals at Lyot Crater


The Minister normally doesn't write about Mars here at MinSEx, as he does so at one of his other blogs, Areology. However, the Minister has a plethora of potential stories to write about with regard to Mars and stories about the rest of the universe are more scarce at the moment. So he will switch gears for today and invite his readers, if they have any interest in the planet Mars, to join him at Areology.

Lyot Crater, pictured here, is one of at least nine craters in the northern lowlands of Mars with exposures of hydrated minerals detected from orbit, according to a June 25, 2010, report.

These minerals, including phyllosilicates, have previously been found in thousands of small outcrops in the southern highlands of Mars, but had not previously been identified in the northern lowlands, which cover nearly half of the planet. The plentiful outcrops in the south have been interpreted as evidence that early Mars -- about 4 billion years ago -- had wet conditions necessary for producing phyllosilicates and possibly conducive to life.

The exposures in some northern craters suggest these minerals are in an older layer underneath the younger surface of northern Mars and are made visible where crater-forming impacts have exposed the underlying material. The new report by John Carter of the University of Paris and co-authors in the journal Science says that the northern finds suggest the ancient, wet conditions extended globally. Their report draws upon observations by the Compact Reconnaissance Imaging Spectrometer for Mars (CRISM) aboard NASA's Mars Reconnaissance Orbiter and the OMEGA spectrometer aboard the European Space Agency's Mars Express orbiter.

Lyot spans 236 kilometers (147 miles) in diameter, centered at 50.5 degrees north latitude, 29.3 degrees east longitude.

This view of the crater combines mapping by NASA's Project Viking with elevation information from the Mars Orbiter Laser Altimeter instrument on NASA's Mars Global Surveyor orbiter. Annotations in Figure 1 indicate where hydrated minerals have been identified in observations by CRISM and OMEGA.

Photo credit: NASA/ESA/JPL-Caltech/JHU-APL/IAS

Monday, June 28, 2010

Forked Impact Melt on the Lunar Far Side


Young, Copernican-aged lunar impact craters exhibit spectacular deposits of lava-like material produced by shock melting in and around the craters. These lunar impact melts are observed as thin, hard-rock veneers, flows, and ponds. Today's Featured Image highlights a spectacular example of a large impact melt flow that flowed from a young small highlands crater (~3.1 km in diameter). The distal portion of this curved impact melt flow splits into two separate flows [above] about 2.5 km from the crater rim. What caused this impact melt flow to fork?

Local topography most likely influenced the impact melt flow path. At the point where the two flows diverge, the main flow is 320 m wide. The northern flow segment extends 675 m beyond the point of divergence and is 200 m wide near its end. The northeastern segment extends for 550 m from the main flow and is 210 m wide near its end. Both flow segments exhibit numerous cracks along portions of their lengths.

The impact melt deposits associated with this farside crater are unique for two reasons. First, the volume of melt present on the crater exterior is exceptionally large, especially when compared to the melt deposits observed on the crater floor. Second, the exterior melt deposits are found at large distances from the crater rim. Studies of impact melt deposits during the Apollo era indicated that craters in the ~3-4 km diameter size range exhibited only very small volumes of exterior melt concentrated near the rim crests.


Photo credit: NASA/GSFC/Arizona State University

Sunday, June 27, 2010

Brown Dwarf SDWFS J143524.44+335334.6


This image shows what astronomers think is one of the coldest brown dwarfs discovered so far (red dot in middle of frame). The object, called SDWFS J143524.44+335334.6, is one of 14 such brown dwarfs found by NASA's Spitzer Space Telescope using infrared light. Follow-up observations are required to nail down this "failed" star's temperature, but rough estimates put this particular object at about 600 Kelvin (620 degrees Fahrenheit).

In this image, infrared light with a wavelength of 3.6 microns is color-coded blue; 4.5-micron light is red. The brown dwarf shows up prominently in red because methane is absorbing the 3.6-micron, or blue-coded, light.

Photo credit: NASA/JPL-Caltech

Saturday, June 26, 2010

The Earth from the Moon


While a series of WAC [Wide Angle Camera] calibration images of the Earth were being acquired, the Narrow Angle Camera (NAC) was shuttered to capture this spectacular Earth view. The bottom of the Earth was clipped because the prediction of the exact time when the cameras' fields of view would cross the Earth was off by a few seconds.

Since the NAC acquires only one line of a picture at a time, the spacecraft had to be nodded across the Earth to build up the scene. The NAC Earth view is actually a mosaic of NAC-Left and NAC-Right images put together after calibration. The distance between the Moon and the Earth was 372,335 km when the picture was taken, with a pixel scale of about 3.7 km, and the center of this view of the Earth is 25°N latitude, 114°E longitude (a few hundred kilometers north of Hong Kong).

It was a beautiful clear summer day over the North Pole, you can see ice covering most of the Arctic Ocean with a few leads of open water (dark) starting to open up. If you look very closely you can follow the Lena River upstream from the Arctic Ocean all the way to Lake Baikal. Much of the Middle East was clear and you can trace spectacular swirl patterns of folded rock layers through Iran, Afghanistan, and Pakistan (geology knows no borders!). These mountains formed as the Eurasian and Arabian tectonic plates collided.

Photo credit: NASA / GSFC / Arizona State University

Friday, June 25, 2010

The Tropics of Venus


This UV image of the Venus "tropics" was taken by the Venus Express Venus Monitoring Camera (VMC) from a distance of approximately 15,000 km (orbit #920, 27 October 2008). The southern pole is in the upper right corner of the image. The dark area in the lower left is the sub-solar region; small-scale wind streaks on its border mark regions of vigorous dynamics.

Photo credit: ESA/MPS/DLR/IDA

Notes: For more information, see Venus Express Shows Off New Findings at Major Conference.

Thursday, June 24, 2010

Adios El Niño, Hello La Niña?


The moderate El Niño of the past year has officially bowed out, leaving his cool sibling, La Niña, poised to potentially take the equatorial stage.

The latest image of Pacific Ocean sea surface heights from the NASA/European Ocean Surface Topography Mission/Jason-2 oceanography satellite, dated June 11, 2010, shows that the tropical Pacific has switched from warm (red) to cold (blue) during the last few months. The blue area in the center of the image depicts the recent appearance of cold water hugging the equator, which the satellite measures as a region of lower-than-normal sea level. Remnants of the El Niño warm water pool, shown here in red and yellow, still linger north and south of the equator in the center of the image.

The image shows sea surface height relative to normal ocean conditions. Red (warmer) areas are about 10 centimeters (4 inches) above normal. Green areas indicate near-normal conditions. Purple (cooler) areas are 14 to 18 centimeters (6 to 7 inches) below normal. Blue areas are 5 to 13 centimeters (2 to 5 inches) below normal.

"The central equatorial Pacific Ocean could stay colder than normal into summer and beyond, because sea level is already about 10 centimeters (4 inches) below normal, creating a significant deficit of the heat stored in the upper ocean," said JPL oceanographer and climatologist Bill Patzert. "The next few months will reveal if the current cooling trend will eventually evolve into a long-lasting La Niña situation."

A La Niña is essentially the opposite of an El Niño. During a La Niña, trade winds in the western equatorial Pacific are stronger than normal and the cold water that normally exists along the coast of South America extends to the central equatorial Pacific. La Niñas change global weather patterns and are associated with less moisture in the air, resulting in less rain along the coasts of North and South America. They also tend to increase the formation of tropical storms in the Atlantic.


Image credit: NASA/JPL Ocean Surface Topography Team

Wednesday, June 23, 2010

N11 in the LMC


A spectacular new NASA/ESA Hubble Space Telescope image - one of the largest ever released of a star-forming region - highlights N11, part of a complex network of gas clouds and star clusters within our neighboring galaxy, the Large Magellanic Cloud. This region of energetic star formation is one of the most active in the nearby Universe.

The Large Magellanic Cloud contains many bright bubbles of glowing gas. One of the largest and most spectacular has the name LHA 120-N 11, from its listing in a catalog compiled by the American astronomer and astronaut Karl Henize in 1956, and is informally known as N11. Close up, the billowing pink clouds of glowing gas make N11 resemble a puffy swirl of fairground candy floss. From further away, its distinctive overall shape led some observers to nickname it the Bean Nebula. The dramatic and colorful features visible in the nebula are the telltale signs of star formation. N11 is a well-studied region that extends over 1,000 light-years. It is the second largest star-forming region within the Large Magellanic Cloud and has produced some of the most massive stars known.

It is the process of star formation that gives N11 its distinctive look. Three successive generations of stars, each of which formed further away from the center of the nebula than the last, have created shells of gas and dust. These shells were blown away from the newborn stars in the turmoil of their energetic birth and early life, creating the ring shapes so prominent in this image.

Beans are not the only terrestrial shapes to be found in this spectacular high resolution image from the NASA/ESA Hubble Space Telescope. In the upper left is the red bloom of nebula LHA 120-N 11A. Its rose-like petals of gas and dust are illuminated from within, thanks to the radiation from the massive hot stars at its center. N11A is relatively compact and dense and is the site of the most recent burst of star development in the region.

Other star clusters abound in N11, including NGC 1761 at the bottom of the image, which is a group of massive hot young stars busily pouring intense ultraviolet radiation out into space. Although it is much smaller than our own galaxy, the Large Magellanic Cloud is a very vigorous region of star formation. Studying these stellar nurseries helps astronomers understand a lot more about how stars are born and their ultimate development and lifespan.

Both the Large Magellanic Cloud and its small companion, the Small Magellanic Cloud, are easily seen with the unaided eye and have always been familiar to people living in the southern hemisphere. The credit for bringing these galaxies to the attention of Europeans is usually given to Portuguese explorer Fernando de Magellan and his crew, who viewed it on their 1519 sea voyage. However, the Persian astronomer Abd Al-Rahman Al Sufi and the Italian explorer Amerigo Vespucci recorded the Large Magellanic Cloud in 964 and 1503 respectively.

Photo credit: NASA, ESA and Jesús Maíz Apellániz (Instituto de Astrofísica de Andalucía, Spain)

Tuesday, June 22, 2010

Dione and Titan


The surface of Saturn's moon Dione is rendered in crisp detail against a hazy, ghostly Titan.

A portion of the "wispy" terrain of Dione's trailing hemisphere can be seen on the right (see PIA12553). Also visible in this image are hints of atmospheric banding around Titan's north pole. To learn more about the northern bands, see PIA08868 and PIA08928. This view looks toward the Saturn-facing hemisphere of Dione (1,123 kilometers, or 698 miles across) and Titan (5,150 kilometers, or 3,200 miles across).

The image was taken in visible blue light with the Cassini spacecraft narrow-angle camera on April 10, 2010. The view was acquired at a distance of approximately 1.8 million kilometers (1.1 million miles) from Dione and 2.7 million kilometers (1.7 million miles) from Titan. Scale in the original image was 11 kilometers (7 miles) per pixel on Dione and 16 kilometers (10 miles) on Titan. The image has been magnified by a factor of 1.5 and contrast-enhanced to aid visibility.

Photo credit:

Monday, June 21, 2010

The Gruithuisen Domes


All three of the Gruithuisen Domes and the surrounding terrain are shown in WAC frame M117752970. Image width is 64 km and illumination is from the left.

The Gruithuisen Domes, a Constellation program region of interest, are located on the northeast border of Oceanus Procellarum at the highlands-mare boundary. The three Gruithuisen domes are named for nearby Gruithuisen crater. The two largest domes have been unofficially referred to for many years as Gruithuisen Gamma and Gruithuisen Delta, with the smallest dome called NW (for "northwest").

The Gruithuisen Domes are classified by lunar scientists as "nonmare" volcanic domes. This is because we know from Earth-based telescopes, Lunar Prospector gamma-ray spectroscopy data, and Clementine multispectral data that the domes are composed of materials different from either the mare or highlands. The Gruithuisen Domes are characterized by a relatively high albedo and strong absorptions in the visible and ultraviolet, and the domes are low in iron and titanium compared to the volcanic deposits of the lunar mare. Previous studies of this region showed that Gruithuisen may represent a lunar analog to terrestrial rhyolites, dacites, or basaltic andesites, which are characterized by viscous lava and low extrusion rates. In comparison, mare volcanic domes (like the Marius Hills and Hortensius, also Constellation regions of interest) are similar to mare basalts in composition, and are generally flatter, smaller, as well as more common on the lunar surface.

Due to the unique nature of the Gruithuisen Domes, they are a high-priority target for future human lunar exploration. What geologic process created these domes here -- and when? How did the magmas that formed the Gruithuisen domes differ from the magmas that formed the highlands and the mare? Since significant scientific questions remain about the mechanics of lunar mare formation, understanding how the Gruithuisen Domes differ from typical mare basalts will enable us to answer these and other important questions about the formation and evolution of terrestrial planets.

Photo credit: NASA/GSFC/Arizona State University

Sunday, June 20, 2010

V385 Carinae


Some might see a blood-red jellyfish in a forest of seaweed, while others might see a big, red eye or a pair of lips. In fact, the red-colored object in this new infrared image from NASA's Wide-field Infrared Survey Explorer (WISE) is a sphere of stellar innards, blown out from a humongous star.

The star (white dot in center of red ring) is one of the most massive stellar residents of our Milky Way galaxy. Objects like this are called Wolf-Rayet stars, after the astronomers who found the first few, and they make our sun look puny by comparison. Called V385 Carinae, this star is 35 times as massive as our sun, with a diameter nearly 18 times as large. It's hotter, too, and shines with more than one million times the amount of light.

Fiery candles like this burn out quickly, leading short lives of only a few million years. As they age, they blow out more and more of the heavier atoms cooking inside them -- atoms such as oxygen that are needed for life as we know it.

The material is puffed out into clouds like the one that glows brightly in this WISE image. In this case, the hollow sphere showed up prominently only at the longest of four infrared wavelengths detected by WISE. Astronomers speculate this infrared light comes from oxygen atoms, which have been stripped of some of their electrons by ultraviolet radiation from the star. When the electrons join up again with the oxygen atoms, light is produced that WISE can detect with its 22-micron infrared light detector. The process is similar to what happens in fluorescent light bulbs.

Infrared light detected by WISE at 12 microns is colored green, while 3.4- and 4.6-micron light is blue. The green, kelp-looking material is warm dust, and the blue dots are stars in our Milky Way galaxy.

This image mosaic is made up of about 300 overlapping frames, taken as WISE continues its survey of the entire sky -- an expansive search, sure to turn up more fascinating creatures swimming in our cosmic ocean.

V385 Carinae is located in the Carina constellation, about 16,000 light-years from Earth.

Photo credit: NASA/JPL-Caltech/UCLA

Saturday, June 19, 2010

Ultraviolet Tail of IC 3418


NASA's Galaxy Evolution Explorer found a tail behind a galaxy called IC 3418. The star-studded tail can be seen on the left, as detected by the space telescope in ultraviolet light. The tail has escaped detection in visible light, as shown by the image on the right, taken by a visible-light telescope on the ground. This tail was created as the galaxy plunged into gas in a family of galaxies known as the Virgo cluster.

The image on the left is a composite of data from the Galaxy Evolution Explorer (far-ultraviolet light is dark blue and near-ultraviolet light is light blue); and the Sloan Digital Sky Survey (visible light is colored green and red). The image on the right is from the Sloan Digital Sky Survey.

Other galaxies and stars can be seen scattered throughout the image. Another galaxy called IC 3413, which is part of the Virgo cluster, can be seen to the right of IC 3418 as an oval-shaped blob. The bright large dot at upper right is a star in our Milky Way galaxy.

Photo credit: NASA/JPL-Caltech

Note: For more information, see Astronomers Discover Star-Studded Galaxy Tail.

Friday, June 18, 2010

New CoRoT Exoplanets

As of 14 June 2010, the CoRoT family of exoplanets comprises 15 members - the most recent additions being the following six:

CoRoT-8b: At about 70% of the size and mass of Saturn, CoRoT-8b is moderately small compared to the previously known transiting exoplanets. Its internal structure should be similar to that of ice giants, like Uranus and Neptune in our Solar System. It is the smallest planet discovered by the CoRoT team so far after CoRoT-7b, the first transiting Super-Earth.

CoRoT-10b: The orbit of this planet is so elongated that the planet passes both very close to, and very far away from, its parent star. The amount of radiation it receives from the star varies tenfold in intensity, and scientists estimate that its surface temperature may increase from 250 to 600°C, all in the space of 13 Earth-days (the length of the year on CoRoT-10b).

CoRoT-11b: CoRoT-11, the host star of this planet, rotates around its axis in less than two days. For comparison, the Sun's rotation period is 26 days. It is particularly difficult to confirm planets around rapidly rotating stars, so this detection marks a significant achievement for the CoRoT team.

CoRoT-12b, 13b and 14b: These three planets all orbit close to their host star but have very different properties. Although CoRoT-13b is smaller than Jupiter, it is twice as dense. This suggests the presence of a massive rocky core inside the planet. With a radius that is 16 times larger than the Earth, CoRoT-12b belongs to the family of 'bloated hot Jupiters', whose anomalously large sizes are due to the intense stellar radiation they receive. Amazingly, CoRoT-14b which is even closer to its parent star has a size similar to that of Jupiter. Its mass is 7.5 times the mass of Jupiter making the planet 6 times denser. Such a combination, very massive and very hot, is rare and CoRoT-14b is the second such planet discovered so far.

CoRoT-15b: The brown dwarf. CoRoT-15b's mass is about 60 times that of Jupiter. This makes it incredibly dense, about 40 times more so than Jupiter. For that reason, it is classified as a brown dwarf, intermediate in nature between planets and stars. Brown dwarfs are much rarer than planets, which makes this discovery all the more exciting.

The figure above depicts the relative sizes and distances from parent stars of the CoRoT exoplanets.

Illustration credit: CNES

Thursday, June 17, 2010

Pandora and Janus Amid Saturn's Rings


A pair of Saturn's small moons orbit near the planet's rings, which appear well illuminated in this Cassini spacecraft view.

Janus (179 kilometers, or 111 miles across) is near the center of the image and is farther than the rings from Cassini. Pandora (81 kilometers, or 50 miles across) is on the left. This view looks toward the northern, sunlit side of the rings from just above the ringplane.

The image was taken in visible light with the Cassini spacecraft narrow-angle camera on April 17, 2010. The view was acquired at a distance of approximately 2.7 million kilometers (1.7 million miles) from Janus and Pandora. Image scale is 16 kilometers (10 miles) per pixel.

Photo credit: NASA/JPL/Space Science Institute

Wednesday, June 16, 2010

Comet 65/P Gunn


This image from NASA's Wide-field Infrared Survey Explorer (WISE) features Comet 65/P Gunn. Comets are balls of dust and ice left over from the formation of the solar system. As a comet approaches the sun, it is heated and releases gas and dust from its surface, which are blown back by the solar wind into a long, spectacular tail. Comet 65/P Gunn's tail is seen here in red trailing off to the right of the comet's nucleus (near the center of the image).

Comet 65/P Gunn was discovered by James Gunn, a professor at Princeton University, N.J., in 1970. Gunn is the project scientist for the Sloan Digital Sky Survey, another important survey of the sky done in visible light. WISE observed the comet on April 24, 2010, in the constellation Capricornus (just one month after the comet's closest approach to the sun). This is a single-frame observation, covering an area of 1.5 by 1.5 full moons (0.76 by 0.76 degrees).

Comet 65/P Gunn is what is called a short-period comet. It orbits the sun inside the main asteroid belt between the orbits of the planets Mars and Jupiter. The orbit of 65/P Gunn is relatively round compared to many comets, and it takes 6.79 years to complete one trip around the sun. At the time that this image was taken, the comet was at a distance from Earth of 392 million kilometers (243 million miles). For reference, the average distance between the Sun and Earth is 150 million kilometers (93 million miles). The comet's speed relative the sun, when this picture was snapped, was about a whopping 7,700 kilometers per hour (4,800 miles per hour).

Just ahead of the comet is an interesting fuzzy red feature that makes it look something like a swordfish, or narwhal. This "sword," or dust trail, is made of dust particles that have previously been shed by 65/P Gunn as it orbits the sun. The dust is warmed by sunlight and glows in infrared light. Dust trails like this one often can encircle the sun, following the orbital path of the comet that produced it. If a dust trail crosses the orbit of Earth, then a meteor shower can occur as Earth passes through the debris cloud. Most of the particles in a dust trail are only about 0.1 millimeters in size. Comet 65/P Gunn's dust trail is out in the main asteroid belt, so Earth will never pass through it.

Also visible in this image are several asteroids -- chunks of rock and metal leftover from the formation of the solar system -- all of which orbit the sun in the main asteroid belt. Asteroids are much cooler than stars and appear red in this image. The most prominent asteroids in the image are: 2661 Bydzovsky; 89825; 76826; E4813; and 2007 VG119.

WISE sees invisible infrared light, and all four infrared detectors aboard WISE were used to make this image. The colors are representational. In this image, 3.4-micron light is colored blue; 4.6-micron light is green; 12-micron light is orange; and 22-micron light is red. Bluer objects in this image are warmer in temperature, such as stars, while cooler objects, such as asteroids and the comet, are redder in appearance.

Photo credit: NASA/JPL-Caltech/UCLA

Tuesday, June 15, 2010

Titan


The Cassini spacecraft looks toward the dark Senkyo region on Saturn's moon Titan.

Senkyo is the dark region towards the right. Two other dark regions, Aztlan (to the left, slanting down below the equator) and Fensal (left, north of Aztlan), are also shown here. The bright area below Aztlan is called Tsegihi. See PIA11636 for a closer view of Senkyo and to learn more. This view looks toward the Saturn-facing side of Titan (5,150 kilometers, or 3,200 miles across). North on Titan is up and rotated 9 degrees to the left.

The image was taken with the Cassini spacecraft narrow-angle camera on April 8, 2010 using a spectral filter sensitive to wavelengths of near-infrared light centered at 938 nanometers. The view was obtained at a distance of approximately 2.1 million kilometers (1.3 million miles) from Titan and at a Sun-Titan-spacecraft, or phase, angle of 33 degrees. Image scale is 12 kilometers (7 miles) per pixel.

Photo credit: NASA/JPL/Space Science Institute

Monday, June 14, 2010

Retrograde Motion

Yesterday's picture at Astronomy Picture of the Day was an annotated composite photograph of Mars undergoing its retrograde motion between October 2, 2009 and June 5, 2010. The notion of retrograde motion is not always easy to understand (the Minister has tried to explain the concept in various comments around the Internet over the years), but this Youtube video does a good job of explaining the retrograde motion of Mars and predicting the path of the planet against the night sky quite nicely.

Sunday, June 13, 2010

Hunting for Ancient Lunar Impact Basins


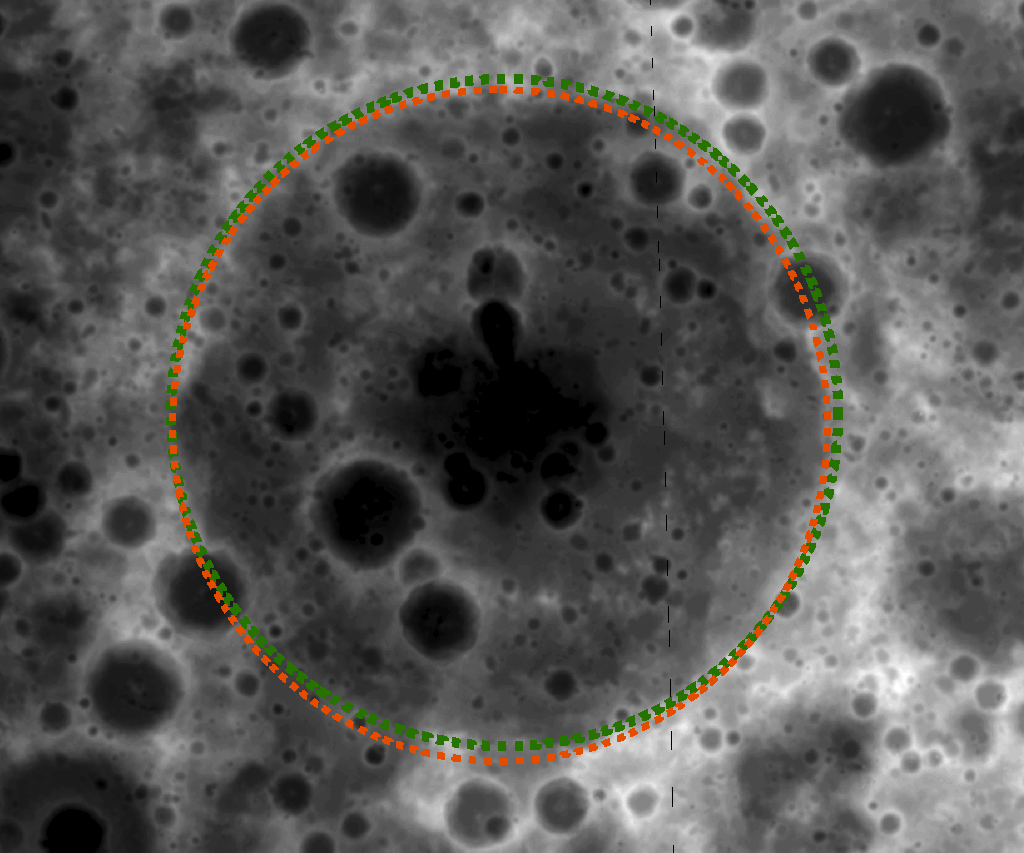
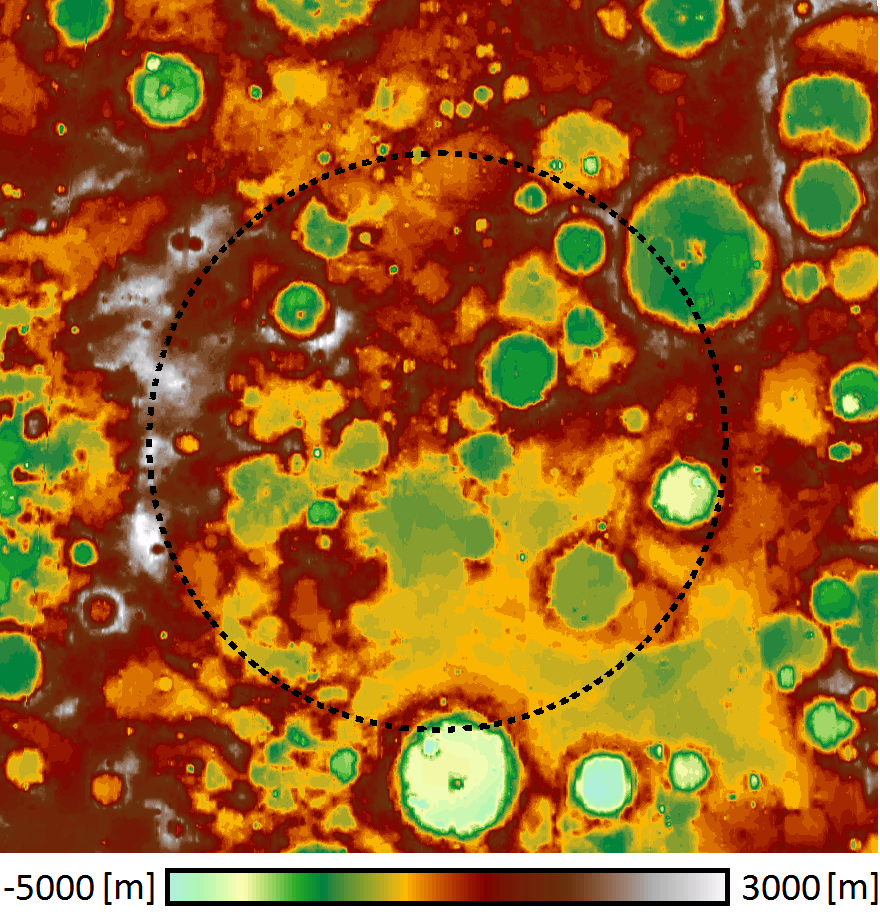
The geographic location of the ancient Nubium basin (20°S, 16°W) is difficult to determine in images. The color-coded DTM (left) and the hill-shaded model (right) help show Nubium due to a slight topographic depression easily seen in the topographic map. Parts of a rim structure can be identified in the southeast, suggesting a basin diameter of about 675 km (black dashed), which is consistent with previous estimates of 690 km (gray dashed, [1]). The mean rim height (the height difference between rim and basin floor) is ~1.8 km according to the DTM. The hill-shaded model accentuates the smooth bottom of Nubium.

Large impact structures represent important time markers and clues to the early history of the Moon. Unfortunately, older basins may be highly degraded and are sometimes difficult to identify in images. Digital Terrain Models (DTMs) allow us to make more confident identifications of lunar basins and to study their morphologies. Large numbers of tentatively identified lunar impact basins, thoroughly listed in catalogs, are awaiting verification and detailed investigation of their ages.

Previous lunar topographic data sets used for studies of basins include the stereo model derived from Clementine images (5 km resolution). Currently, LRO's Lunar Orbiter Laser Altimeter (LOLA) is collecting a global topographic dataset. Due to LRO's polar orbit, the LOLA topographic products have high resolution (better than 40 m) at the poles and suffer from orbit gaps of about a kilometer in the equatorial areas. The DTM of the Nubium basin [above] was made from overlapping WAC images obtained in adjacent orbits. The topography has a uniform global spatial resolution of 500 m except at the poles where deep shadows results in area of no coverage. Using these new WAC topographic data, several degraded impact structures were positively confirmed [the Freundlich-Sharonov impact basin and Nubium above]. However, at this time, other basins such as Marginis [image] are not yet positively confirmed.

Photo credits: NASA/GSFC/Arizona State University/DLR