Pages

Friday, December 31, 2010

Acetylene at Jupiter's North and South Poles


These images and movie show the distribution of the organic molecule acetylene at the north and south poles of Jupiter, based on data obtained by NASA's Cassini spacecraft in early January 2001. It is the highest-resolution map of acetylene to date on Jupiter. The enhanced emission results both from the warmer temperatures in the auroral hot spots, and probably also from an enhanced abundance in these regions. The detection helps scientists understand the chemical interactions between sunlight and molecules in Jupiter's stratosphere.

These maps were made by NASA's composite infrared spectrometer.


Photo and video credit: NASA/JPL/GSFC

Thursday, December 30, 2010

Anaglyph Image of Rhea's Cratered Terrain


Wispy fractures cut through cratered terrain on Saturn's moon Rhea in this high resolution, 3-D image from NASA's Cassini spacecraft. The image shows a level of detail not seen previously.

This 3-D view is a mosaic made from 11 different black and white images that were taken from slightly different viewing angles. The images are combined so that the viewer's left and right eye, respectively and separately, see a left and right image of the black and white stereo pair when viewed through red-blue glasses.

Although Rhea's surface is mostly densely cratered, indicating little geologic evolution, the area depicted in this image tells a different story through evidence of tectonic activity. A set of closely spaced scarps and troughs that vary from linear to sinuous cuts through older, densely cratered plains. While the densely cratered plains imply that Rhea has not experienced much internally-driven activity since its early history, these imaging data suggest that tectonic stress has been active in more recent geologic times, at least in some regions. Troughs and other fault topography cut through the two largest craters in the scene, which have few smaller craters superimposed on them, indicating that these large craters are comparably young. The image also indicates the tectonic forms transecting the large craters' rims and floors are comparably young. The fractures seen here reach depths of as much as 4 kilometers (about 2.5 miles). In some places, material has moved down-slope along the scarps and accumulated on the flatter floors.

The images were projected to an orthographic map with a scale of 140 meters (460 feet) per pixel for both stereo partners. The anaglyph is centered at 12 degrees North latitude, 273 degrees West longitude. Terrain seen here is on the trailing hemisphere of Rhea (1,528 kilometers, 949 miles across). The images were taken in visible light with the Cassini spacecraft narrow-angle camera on November 21, 2009. The view was obtained at a distance of approximately 25,000 kilometers (16,000 miles) from Rhea.

Photo credit: NASA/JPL/Space Science Institute

Wednesday, December 29, 2010

Sunset on Mars


The Sun descends to the Martian horizon and sets in this 30-second movie simulation using images from the panoramic camera (Pancam) on NASA's Mars Exploration Rover Opportunity. The movie includes images that have been calibrated and enhanced, plus simulated frames used to smooth the action.

The rover team uses the Pancam to view sunsets a few times a year, when rover power is adequate, as a way to monitor distribution and variability of dust in the lower atmosphere.

This movie builds on 17 individual photos of the sky around the Sun taken through the Pancam's 440 nanometer-wavelength (blue), and 864 nanometer-wavelength (near infrared) filters, every 7.5 seconds during about 17 minutes of sunset on Opportunity's 2411th Martian day, or sol (November 5, 2010). The Sun's glare saturated parts of those images and so the moviemakers removed the glare and inserted a non-saturated image of the Sun from the previous day's imaging using Pancam's special solar filter. They then supplemented this non-glare snapshot with interpolated frames to simulate the smoother motion of the setting Sun.

The end result simulates watching the Sun set on Mars using a good pair of dark sunglasses, with the whole event sped up to about 35 times the actual speed.

Video credit: NASA/JPL-Caltech/Cornell/Texas A&M

Tuesday, December 28, 2010

Soyuz Night Liftoff


Soyuz lift-off with ESA astronaut Paolo Nespoli together with Dmitri Kondratyev and Catherine Coleman for a challenging 6-month mission on the International Space Station (ISS) as members of Expeditions 26/27. They were launched in the Soyuz TMA-20 spacecraft from Baikonur Cosmodrome in Kazakhstan on 15 December at 20:09 CET.

Paolo’s MagISStra mission will be Europe’s third long-duration mission on the ISS. Between December 2010 and June 2011 he will be part of the ISS crew as a flight engineer.

Photo credit: ESA - S. Corvaja, 2010

Monday, December 27, 2010

Crater on the Rim of Schiaparelli Crater


Schiaparelli is a large impact basin about 460 km across, located in the eastern Terra Meridiani region of the planet’s equator. The image shows just a small part of the basin’s northwestern rim cutting diagonally across the image (top left–bottom right) and a smaller 42-km-diameter crater embedded in its rim. The image is centered on the equator of Mars, at a longitude of about 14° East. The image was taken on 15 July 2010 by the High-Resolution Stereo Camera (HRSC) on ESA’s Mars Express. The spacecraft was completing orbit 8363 of Mars and the ground resolution of the image is about 19 m per pixel.

Photo credit: ESA/DLR/FU Berlin (G. Neukum)

Note: For more information and photos, see Wind and Water Have Shaped Schiaparelli on Mars.

Sunday, December 26, 2010

Waves Breaking in the Stellar Lagoon


This close-up shot of the center of the Lagoon Nebula (Messier 8) clearly shows the delicate structures formed when the powerful radiation of young stars interacts with the hydrogen cloud they formed from.

This image was created from exposures taken with the Wide Field Channel of the Advanced Camera for Surveys (ACS) on Hubble. Light from glowing hydrogen (through the F658N filter) is colored red. Light from ionized nitrogen (through the F660N filter) is colored green and light through a yellow filter (F550M) is colored blue. The exposure times through each filter are 1560 seconds, 1600 seconds and 400 seconds respectively. The blue-white flare at the upper-left of the image is scattered light from a bright star just outside the field of view. The field of view is about 3.3 by 1.7 arcminutes.

Photo credit: NASA, ESA

Saturday, December 25, 2010

Rimae Posidonius


Spanning over 130 km in length, Rimae Posidonius is a sinuous rille winding across the floor of Posidonius Crater. LROC WAC mosaic at 100 m/pixel, arrow points to the rille and location of an LROC NAC close-up.

Sinuous rilles are remarkable features resulting from turbulent flow of low viscosity (very fluid), high temperature lavas that erodes the pre-existing surface. In turbulent fluid flows, eddies and vortices form that can be highly erosive and result in the twists and turns seen in many rilles. This rille, located on the western edge of Posidonius Crater (~100 km diameter, floor-fractured and partially mare-filled), tightly winds against the northern crater wall and then veers away in a southerly course.


Close-up view of boulders, derived from the mare lavas that flooded the crater, outcropping from the eastern rille wall. The rille is on the left of the exposed rocks, image width is 500 m.

Why are scientists captivated by sinuous rilles? Part of the reason is purely aesthetic - each sinuous rille is different. Some sinuous rilles are less curvy, some - like Rimae Posidonius - look like squiggles, while yet other rilles are so windy that they have horseshoe-shaped curves. Scientifically, however, sinuous rilles are exciting because it's possible to see layers of mare lavas that were cut through during the rille formation - as long as the regolith slumping down the walls isn't thick enough to obscure them! Besides exposing layers in the lava flows, rilles also give you an almost dynamic look at where lava flowed, suggesting very high effusion rates over long periods of time (often much higher than typical of those on Earth). Some rilles are believed to contain pyroclastics, which can tell scientists something about the volcanic history of the rille. Sinuous rilles in the Rimae Prinz region of the Moon may even host a lava tube network; lava tubes may be instrumental in future human exploration activities.

Photo credit: NASA/GSFC/Arizona State University

Friday, December 24, 2010

Chasing Chickens in the Lambda Centauri Nebula


This infrared image from NASA's Wide-field Infrared Survey Explorer, or WISE, shows the Lambda Centauri nebula, a star-forming cloud in our Milky Way galaxy, also known as the Running Chicken Nebula. The nebula, cataloged as IC 2944, is about 5,800 light-years from Earth and is home to a new cluster of stars born from the cloud nearly 8 million years ago. The hottest members of the cluster produce enough ultraviolet radiation and strong winds to convert the cloud into ions and excavate it. The ionized gas glows in visible light, but in infrared light we see the dust in the cloud warmed by the very same radiation. The red, glowing dust is the coolest material visible in this image and is composed of metallic dust grains. The greenish components in the image are warmer dust grains composed of smog-like materials. The large green ring-like structure near the middle of the image is some 77 light-years across and was formed when materials that created the stars in the clusters were blown back by the combined winds of the stars.

The nebula gets its common name because in some visible light images it resembles a running chicken. It is also called the Lambda Centauri Nebula because it appears to surround the bright star Lambda Centauri. Lambda Centauri is one of the brightest stars in the constellation Centaurus. The brightest stars in the sky are named based on the constellation they are in. For example, the brightest star in the constellation Centaurus is Alpha Centauri, the next brightest star in that constellation is Beta Centauri, and so forth. Lambda Centauri is therefore the 11th brightest star in the constellation Centaurus. It is not so bright in infrared light, however. In this WISE image, it appears as the dimmer, lower, and bluer of two bright stars in the upper right-hand corner of the image. It is a blue giant star about 410 light-years away. So, in fact, Lambda Centauri is much closer to Earth than IC 2944 and has nothing to do with the nebula at all.

This image is a four-color composite created by all four of WISE's infrared detectors. Color is representational: blue and cyan represent infrared light observed at wavelengths of 3.4 and 4.6 microns, which is mostly light from stars. Green and red represent light observed at 12 and 22 microns, which is mostly light from warm dust, with red indicating temperatures lower than green.

Photo credit: NASA/JPL-Caltech/UCLA

Thursday, December 23, 2010

False-Color Rhea


Hemispheric color differences on Saturn's moon Rhea are apparent in this false-color view from NASA's Cassini spacecraft. This image shows the side of the moon that always faces the planet.

In this image, the left half of the visible disk of Rhea faces in the direction of Rhea's orbital motion around Saturn, while the right side faces the trailing direction. It is not unusual for large icy Saturnian satellites to exhibit hemispheric albedo (reflectivity) and color differences. These differences are likely related to systematic regional changes in surface composition or the sizes and mechanical structure of grains making up the icy soil. Such large-scale variations can arise from numerous processes, such as meteoritic debris preferentially hitting one side of Rhea. The differences can also arise from "magnetic sweeping,"� a process that happens when ions that are trapped in Saturn's magnetic field drag over and implant themselves in Rhea's icy surface. The slightly reddish false-color hues near Rhea's poles identify subtle composition changes that might be caused by differences in the surface exposure to meteoric debris falling into the moon or implantation of ions. These differences could vary by latitude. They suggest that at least some of the color differences are exogenic, or derived externally.

This view was captured during Cassini's March 2, 2010 flyby of Rhea. To create the false-color view, ultraviolet, green and infrared images were combined into a single picture that isolates and maps regional color differences. This "color map" was then superimposed over a clear-filter image [see below] that preserves the relative brightness across the body.

For other false-color views of this moon, see PIA08871, PIA08120 and PIA07769.

This view looks toward the Saturn-facing side of Rhea (1528 kilometers, 949 miles across). North is up. The images were taken with the Cassini spacecraft wide-angle camera. The view was acquired at a distance of approximately 35,000 kilometers (22,000 miles) from Rhea and at a Sun-Rhea-spacecraft, or phase, angle of 3 degrees. Image scale is 2 kilometers (1 mile) per pixel.


Photo credit: NASA/JPL/Space Science Institute

Wednesday, December 22, 2010

Abell 644 and SDSS J1021+131: How Often Do Giant Black Holes Become Hyperactive?


This two-panel graphic contains two composite images of galaxies used in a recent study of supermassive black holes. In each of the galaxies, data from NASA's Chandra X-ray Observatory are blue, and optical data from the Sloan Digital Sky Survey are shown in red, yellow and white. The galaxy on the left, Abell 644, is in the center of a galaxy cluster that lies about 920 million light years from Earth. On the right is an isolated, or "field," galaxy named SDSS J1021+1312, which is located about 1.1 billion light years away. At the center of both of these galaxies is a growing supermassive black hole, called an active galactic nucleus (AGN) by astronomers, which is pulling in large quantities of gas.

A newly published study from Chandra tells scientists how often the biggest black holes in field galaxies like SDSS J1021+1312 have been active over the last few billion years. This has important implications for how environment affects black hole growth. The scientists found that only about one percent of field galaxies with masses similar to the Milky Way contain supermassive black holes in their most active phase. They also found that the most massive galaxies are the most likely to host these AGN, and that there is a gradual decline in the AGN fraction with cosmic time. Finally, the AGN fraction for field galaxies was found to be indistinguishable from that for galaxies in dense clusters, like Abell 644.

This study involves a survey called the Chandra Multiwavelength Project, or ChaMP, which covers 30 square degrees on the sky, the largest area covered of any Chandra survey to date. Combining Chandra's X-ray images with optical images from the Sloan Digital Sky Survey, about 100,000 galaxies were analyzed. Out of those, about 1,600 were bright in X-ray light, signaling possible AGN activity.

Photo credit: X-ray: NASA/CXC/Northwestern Univ/D.Haggard et al, Optical: SDSS

Tuesday, December 21, 2010

Dark Gamma Ray Bursts


This artist’s impression shows a dark gamma-ray burst in a star forming region. Gamma-ray bursts are among the most energetic events in the Universe, but some appear curiously faint in visible light. The biggest study of these dark gamma-ray bursts to date, using the GROND instrument on the 2.2-meter MPG/ESO telescope at La Silla in Chile, has found that these gigantic explosions, while puzzling, don't require exotic explanations. Their faintness is now fully explained by a combination of causes with the most important being the presence of dust between the Earth and the explosion.

Illustration credit: ESO/L. Calçada

Note: For more information, see Light Dawns on Dark Gamma-ray Bursts.

Monday, December 20, 2010

Harrat Lunayyir, Saudi Arabia


A swarm of thousands of earthquakes that struck the corner of Saudi Arabia nearest to Egypt in 2009 helped reveal that the area is unexpectedly volcanically active. Scientists had largely thought northwest Saudi Arabia was quiet, geologically speaking. Few earthquakes and few volcanic eruptions have been recorded there in the past millennium. However, between April and June 2009, more than 30,000 micro-earthquakes struck an ancient lava field there named Harrat Lunayyir, with 19 earthquakes of magnitude 4 or greater, including one quake that fractured walls at a nearby town. The image was acquired October 8, 2006, covers an area of 57 x 57 km, and is located near 25.2 degrees North latitude, 37.8 degrees East longitude.

Photo credit: NASA/GSFC/METI/ERSDAC/JAROS, and U.S./Japan ASTER Science Team

Sunday, December 19, 2010

Santa Maria Crater


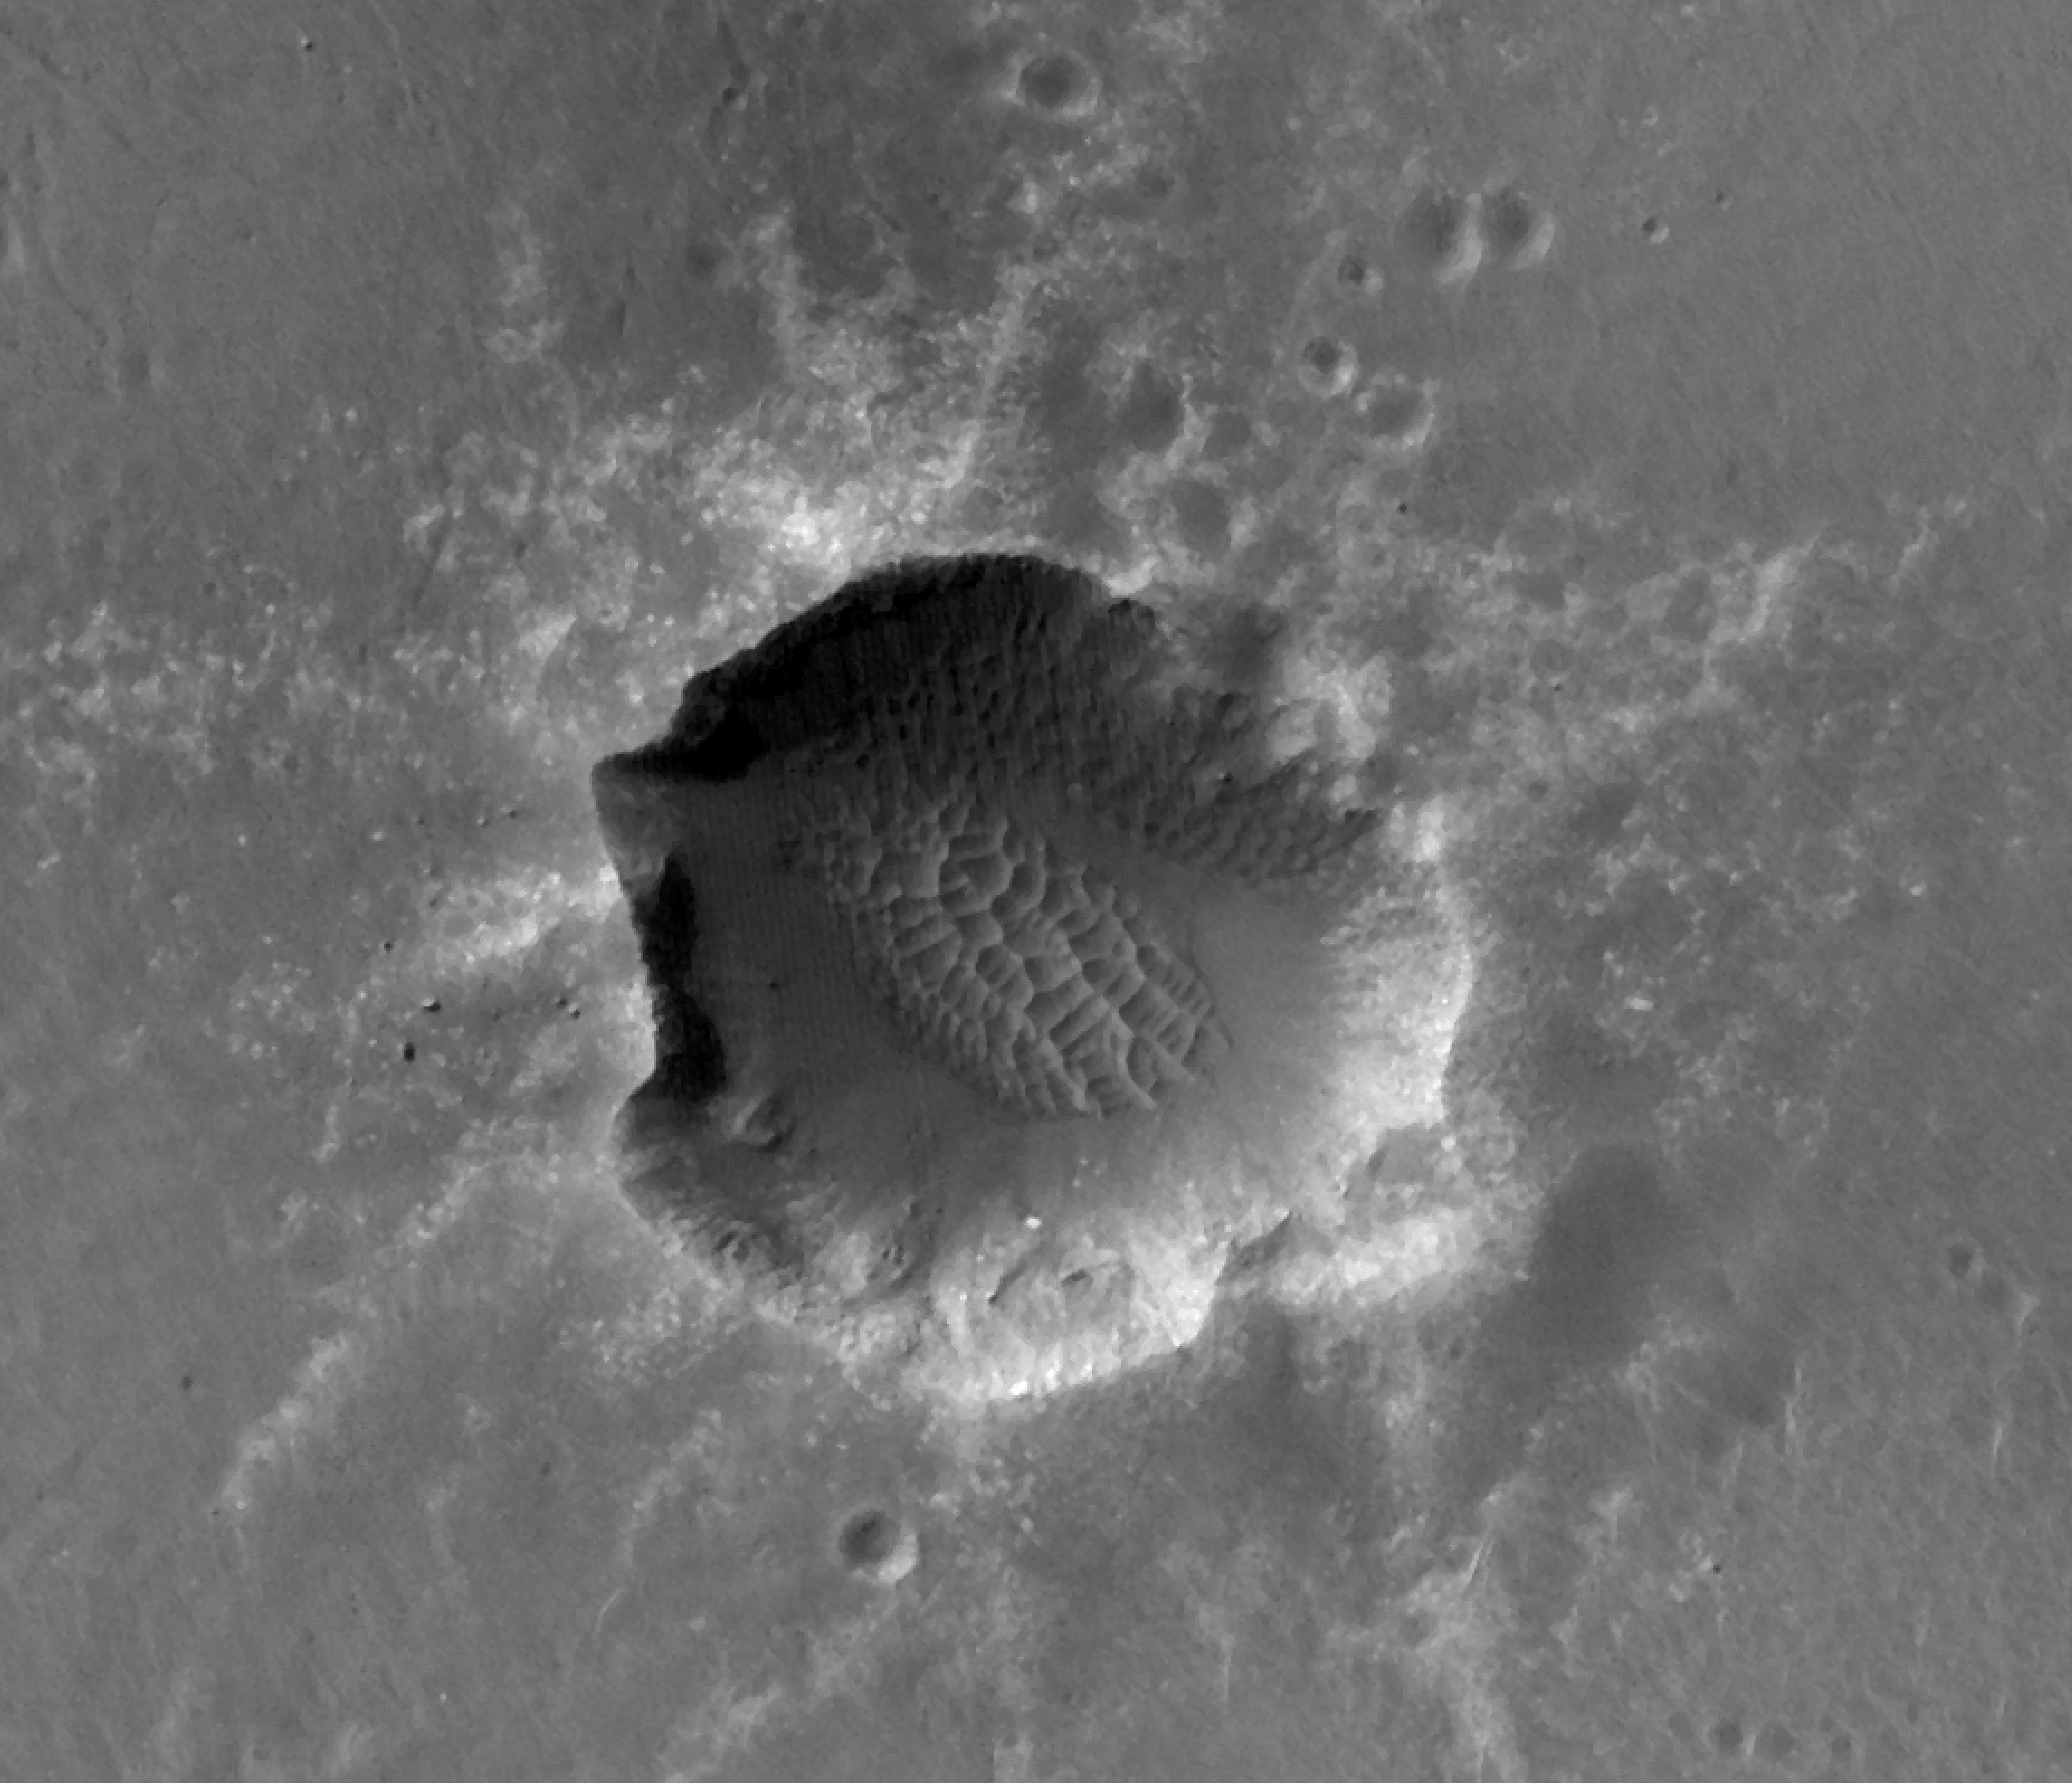
NASA's Mars Exploration Rover Opportunity approached Santa Maria Crater in December 2010. With a diameter of about 90 meters (295 feet), this crater is slightly smaller than Endurance Crater, which Opportunity explored for about half a year in 2004.

This image of Santa Maria Crater was taken by the High Resolution Imaging Science Experiment (HiRISE) camera on Mars Reconnaissance Orbiter.

The rover team plans to use Opportunity for investigating Santa Maria for a few weeks before resuming the rover's long-term trek toward Endeavour Crater. One planned target area is at Santa Maria's southeast rim. The red circle marked there on Figure 1 indicates the pixel size and location of an observation by the Compact Reconnaissance Imaging Spectrometer for Mars (CRISM) on NASA's Mars Reconnaissance Orbiter that has piqued researchers' interest. The spectrum recorded by CRISM for this spot, unlike the spectrum recorded for the place indicated by the blue circle on the floor of the crater, suggests what might be a water-bearing sulfate mineral. Although Opportunity has detected such minerals on the surface during its nearly seven years on Mars, none have been detected from orbit at a place visited by Opportunity.

Photo credit: NASA/JPL-Caltech/Univ. of Arizona

Note: For a ground-level view of Santa Maria crater, see PIA13707: Opportunity's View of Santa Maria Crater, Sol 2450.

Saturday, December 18, 2010

Lunar South Pole Illumination Map


Multi-temporal illumination map of the lunar south pole, Shackleton Crater (19 km diameter) is in the center, the south pole is located approximately at 9 o'clock on its rim. Mapped area extends from 88°S to 90°S.

The spin axis of the Moon is tilted by only 1.54° (compared to Earth's 23.5°), leaving some areas near the poles in permanent shadow while other nearby regions remain sunlit for the majority of the year. One of the primary objectives of LROC is to unambiguously identify these regions.

In a six month (six lunar days) period, the LROC Wide Angle Camera (WAC) collected 1,700 images of the South Pole covering the same area. Each image was map projected and converted to a binary image (if the ground was illuminated that pixel was set to one, and if shadowed zero) to differentiate between sunlit and shadowed regions. All the binary images were then stacked, and then for each pixel it was determined what percentage of the time during six months that spot was illuminated. Presto - an illumination map! The LROC team is making daily (which is about 28 Earth days) and yearly illumination maps for both poles. Such maps will provide the foundation for planning future robotic and human missions to the poles.

Photo credit: NASA/GSFC/Arizona State University

Friday, December 17, 2010

Nearby Galaxies


To celebrate the one-year anniversary of the launch of NASA's Wide-Field Infrared Explorer, or WISE, the mission team has put together this image showing just a sample of the millions of galaxies that have been imaged by WISE during its survey of the entire sky.

NGC 300 is seen in the image in the upper left panel. This is a textbook spiral galaxy. In fact, it is such a good representation of a spiral galaxy that astronomers have studied it in great detail to learn about the structure of all spirals in general. Infrared images like this one from WISE show astronomers where areas of gas and warm dust are concentrated -- features that cannot be seen in visible light. This gas and dust is primarily found near star-forming regions in the spiral arms. There isn't a significant amount of gas and dust in the central core in this type of spiral galaxy, so it appears relatively dim. At about 39,000 light-years across, NGC 300 is only about 40 percent the size of the Milky Way galaxy.

The upper right image shows Messier 104, or M104, also known as the Sombrero galaxy. Although M104 is also classified as a spiral galaxy, it has a very different appearance than NGC 300. In part, this is because the dusty, star-forming spiral disk in M104 is seen nearly edge-on from our point of view. M104 also has a large, ball-shaped bulge component of older stars, seen here in blue. In visible light, a dark dust lane extends across the galaxy, blocking out some of the bright starlight in the disk behind it, and causing it to resemble a sombrero. This dust lane encircles the entire galaxy and glows brightly in infrared; it is seen here as bright circle surrounding a dense galactic core.

The large, fuzzy grouping of stars at the center of the lower left panel is the galaxy Messier 60, or M60. This galaxy does not have a spiral disk, just a bulge, making it a massive elliptical galaxy. M60 is about 20 percent larger than the Milky Way galaxy, and lies in the Virgo cluster of galaxies. The brighter dense spot inside but off-center from the blue core of M60 is a separate spiral galaxy called NGC 4647. In visible light, M60 is much brighter than NGC 4647. However, in the longest infrared wavelengths that WISE sees, the opposite is true. Recent evidence suggests there is a black hole at the center of M60 with a mass of about 4.5 billion times that of the Sun, making it one of the largest black holes known. Two more galaxies are near the upper left corner of this panel, NGC 4638 (the brighter one) and NGC 4637. In addition, two different asteroids were caught crossing the field of view when WISE imaged this portion of the sky (seen as dotted green lines extending out from M60 at about the 2 o'clock and 8 o'clock positions).

The galaxy in the lower right panel is Messier 51, or NGC 5194, also frequently referred to as the Whirlpool galaxy. The Whirlpool is a "grand design" spiral galaxy. It is interacting with its smaller companion -- NGC 5195, a dwarf galaxy, which can be seen as a bright spot near the tip of the spiral arm extending up and to the right of the larger galaxy. The Whirpool's very bright spiral arms show areas of compressed dust and gas. These arms have been enhanced by the recent encounter with NGC 5195.

These images were made from observations by all four infrared detectors aboard WISE. Blue and cyan represent infrared light at wavelengths of 3.4 and 4.6 microns, which is primarily light from stars. Green and red represent light at 12 and 22 microns, which is primarily light emitted from warm dust.

WISE launched into space aboard a Delta II rocket on December 14, 2009, from Vandenberg Air Force Base, California.

Photo credit: NASA/JPL-Caltech/UCLA

Thursday, December 16, 2010

SNR 0509 - A Celestial Bauble


This delicate shell, photographed by the NASA/ESA Hubble Space Telescope, appears to float serenely in the depths of space, but this apparent calm hides an inner turmoil. The gaseous envelope formed as the expanding blast wave and ejected material from a supernova tore through the nearby interstellar medium. Called SNR B0509-67.5 (or SNR 0509 for short), the bubble is the visible remnant of a powerful stellar explosion in the Large Magellanic Cloud (LMC), a small galaxy about 160,000 light-years from Earth. Ripples in the shell's surface may be caused either by subtle variations in the density of the ambient interstellar gas, or possibly be driven from the interior by fragments from the initial explosion. The bubble-shaped shroud of gas is 23 light-years across and is expanding at more than 18 million km/h.

Hubble's Advanced Camera for Surveys observed the supernova remnant on 28 October 2006 with a filter that isolates light from the glowing hydrogen seen in the expanding shell. These observations were then combined with visible-light images of the surrounding star field that were imaged with Hubble's Wide Field Camera 3 on 4 November 2010, and archival X-ray observations taken by NASA's Chandra X-ray Observatory.


Photo credit: NASA, ESA, the Hubble Heritage Team (STScI/AURA), and NASA/CXC/SAO/J. Hughes

Note: For more information, see Hubble Spots a Celestial Bauble [heic1018].

Wednesday, December 15, 2010

Color and Topographic Maps of Tethys


A prime objective of the Cassini orbital mission at Saturn is to characterize the nature and evolution of Saturn's extended family of icy satellites. Cassini observations since the beginning of the prime mission in mid-2004 have made possible the first global maps of these diverse bodies. A team of scientists lead by Dr. Paul Schenk at the Lunar and Planetary Institute in Houston has produced the first global color and topographic maps of these satellites. These two views of Tethys show the high-resolution color (at left) and the topography (at right) of the leading, or forward-facing, hemisphere of this 1060-kilometer-diameter (659-mile-diameter) ice-rich satellite. The color map shows the prominent dusky bluish band along the equator, first seen by Voyager in 1980, and shown by Dr. Schenk's team of scientists to be due to the bombardment and alteration of the surface by high energy electrons traveling slower than the satellite's revolution period. These findings were published in the journal Icarus this autumn.

The general reddish tones may be due to the coating of the Tethyean surface by dust-sized particles ejected by Enceladus' south polar plumes. The view at right is a color-coded topographic map of the same region (blues are low, reds are high). The total range of topography shown is 10 kilometers (6 miles) from highest to lowest point. The dominant feature is the 8-kilometer-deep (5-mile-deep) and 440-kilometer-wide (273-mile-deep) Odysseus impact basin at upper left. Straddling the hemisphere like a belt is a previously unknown topographic ridge between 2 and 3 kilometers (1.2 and 1.9 miles) high. To the east of the ridge lies ordinary rolling cratered plains, but between the ridge and Odysseus the surface is scoured and pockmarked. The base resolution of the color map is 400 meters (1312 feet). The ridge may be a tectonic feature related to the impact event or may be a deposit formed when the ejecta blasted out of Odysseus slammed back onto the surface at high velocity. Visible at bottom right is the globe-circling tectonic canyon, Ithaca Chasma.

This map is part of a set of new global topographic maps produced by Dr. Schenk's team for each of Saturn's icy satellites and previewed on-line at http://stereomoons.blogspot.com.

Photo credit: NASA/JPL/Space Science Institute/Universities Space Research Association/Lunar & Planetary Institute

Tuesday, December 14, 2010

WASP-12b


This artist's concept shows the searing-hot gas planet WASP-12b (orange orb) and its star. NASA's Spitzer Space Telescope discovered that the planet has more carbon than oxygen, making it the first carbon-rich planet ever observed. Our planet Earth has relatively little amounts of carbon -- it is made largely of oxygen and silicon. Other gas planets in our solar system, for example Jupiter, are expected to have less carbon than oxygen, but this is not known. Unlike WASP-12b, these planets harbor water, the main oxygen carrier, deep in their atmospheres, where it is difficult to measure.

Concentrated carbon can take the form of diamond, so astronomers say that carbon-rich gas planets could have abundant diamond in their interiors.

WASP-12b is located roughly 1,200 light-years away in the constellation Auriga. It swings around its star every 1.1 days. Because the planet is so close to its star, the star's gravity stretches it slightly into an egg shape. The star's gravity also pulls material off the planet into a disk around the star (shown here in transparent, white hues).

Illustration credit: NASA/JPL-Caltech

Note: For more information, see PIA13690: Signature of a Carbon-Rich Planet

Monday, December 13, 2010

Dunes in Olympia Undae


A sea of dark dunes, sculpted by the wind into long lines, surrounds the northern polar cap covering an area as big as Texas. In this false-color image, areas with cooler temperatures are recorded in bluer tints, while warmer features are depicted in yellows and oranges. Thus, the dark, sun-warmed dunes glow with a golden color. This image covers an area 30 kilometers (19 miles) wide.

This scene combines images taken during the period from December 2002 to November 2004 by the Thermal Emission Imaging System instrument on NASA's Mars Odyssey orbiter. It is part of a special set of images marking the occasion of Odyssey becoming the longest-working Mars spacecraft in history. The pictured location on Mars is 80.3 degrees north latitude, 172.1 degrees east longitude.

Photo credit: NASA/JPL-Caltech/ASU

Note: These dunes are located in Olympia Undae.

Saturday, December 11, 2010

IC 443 - The Jellyfish Nebula


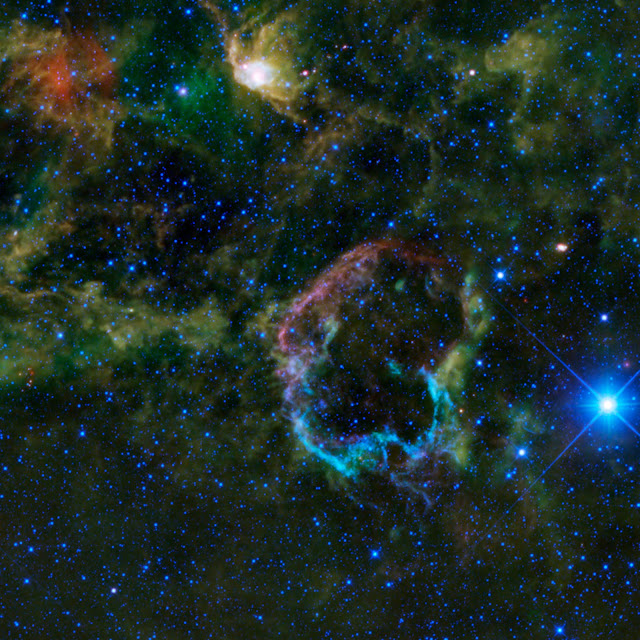
This oddly colorful nebula is the supernova remnant IC 443 as seen by NASA's Wide-field Infrared Survey Explorer, or WISE. Also known as the Jellyfish Nebula, IC 443 is particularly interesting because it provides a look into how stellar explosions interact with their environment. IC 443 can be found near the star Eta Geminorum, which lies near Castor, one of the twins in the constellation Gemini.

Just like human beings, stars have a life cycle -- they are born, mature and eventually die. The manner in which stars die depends on their mass. Stars with mass similar to the Sun typically become planetary nebulae at the end of their lives, whereas stars with many times the Sun's mass explode as supernovae. IC 443 is the remains of a star that went supernova somewhere between 5,000 and 10,000 years ago. The blast from the supernova sent out shock waves that traveled through space, sweeping up and heating the surrounding gas and dust in the interstellar medium, and creating the supernova remnant seen in this image.

What is unusual about the IC 443 is that its shell-like form has two halves that have different radii, structures and emissions. The larger northeastern shell, seen here as the violet-colored semi-circle on the top left of the supernova remnant, is composed of sheet-like filaments that are emitting light from iron, neon, silicon and oxygen gas atoms, in addition to dust particles, all heated by the blast from the supernova. The smaller southern shell, seen here in a bright cyan color on the bottom half of the image, is constructed of denser clumps and knots primarily emitting light from hydrogen gas and heated dust. These clumps are part of a molecular cloud, which can be seen in this image as the greenish cloud cutting across IC 443 from the northwest to southeast. The color differences seen in this image represent different wavelengths of infrared emission.

The differences in color are also the result of differences in the energies of the shock waves hitting the interstellar medium. The northeastern shell was probably created by a fast shock wave (100 kilometers per second or 223,700 miles per hour), whereas the southern shell was probably created by a slow shock wave (30 kilometers per second or 67,100 miles per hour).

All WISE featured images use color to represent specific infrared wavelengths. Blue represents 3.4-micron light, cyan represents 4.6-micron light, green represents 12-micron light and red represents 22-micron light. In this image, we see a mixing of blue and cyan in the southern ridge that is not often seen in other WISE images. The northeastern shell appears violet, indicating a mixture of longer infrared wavelengths from cooler dust (red) and shorter infrared wavelengths from luminescent gas (blue).

Photo credit: NASA/JPL-Caltech/UCLA

Friday, December 10, 2010

The Rays of Hokusai Crater


This mosaic of NAC images shows the impact crater Hokusai, located on Mercury at a latitude of 58° North. The crater has an impressive system of rays, which extend as much as a thousand kilometers (more than 600 miles) across the planet and are the longest that have yet been identified on Mercury.

Such rays are formed when an impact excavates material from beneath the surface and throws that material outward from the crater. These bright rays, consisting of both ejecta and secondary craters that form when the ejected material re-impacts the surface, slowly begin to fade as they are exposed to the harsh space environment. Mercury and other airless planetary bodies are being constantly bombarded with micrometeoroids and energetic ions, producing an effect known as space weathering. Craters with bright rays are thought to be relatively young because the rays are still visible, indicating that they have had less exposure to such weathering processes than craters that lack rays.

Although the extent of some of Hokusai's rays have been determined, images acquired during MESSENGER's three Mercury flybys have not yet shown all of Hokusai's rays. During MESSENGER's orbital observations, which will begin in March 2011, MDIS will acquire high-resolution color images of Mercury's entire surface. This global color map will allow the full extent of the extensive systems of rays emanating from Hokusai and other young craters to be mapped for the first time.

Date Acquired: October 6, 2008
Instrument: Narrow Angle Camera (NAC) of the Mercury Dual Imaging System (MDIS)
Scale: The diameter of Mercury is 4,880 kilometers (3030 miles). Hokusai has a diameter of 95 kilometers (59 miles)

Photo credit: NASA/Johns Hopkins University Applied Physics Laboratory/Carnegie Institution of Washington

Thursday, December 9, 2010

Messier 107


The globular cluster Messier 107, also known as NGC 6171, is located about 21,000 light-years away in the constellation of Ophiuchus. Messier 107 is about 13 arcminutes across, which corresponds to about 80 light-years at its distance. As is typical of globular clusters, a population of thousands of old stars in Messier 107 is densely concentrated into a volume that is only about twenty times the distance between our Sun and its nearest stellar neighbor, Alpha Centauri, across. This image was created from exposures taken through blue, green and near-infrared filters, using the Wide Field Imager (WFI) on the MPG/ESO 2.2-meter telescope at La Silla Observatory, Chile.

Photo credit: ESO/ESO Imaging Survey

Note: For more information, see A Swarm of Ancient Stars.

Wednesday, December 8, 2010

Rilles As Far As The Eye Can See


LROC WAC mosaic of the rille-rich Prinz crater region. Bench-like features are visible in the Prinz B depression and two flows originating in Prinz B converge just west of the arrow.


The bouldery, higher-reflectance mound in the central portion of this image is an island near the source region, Prinz B, for a short sinuous rille. The two rilles join at the triangular tip of this kipuka-like structure and flow northwestward for ~10 km. Image width is 500 m.

Photo credit: NASA/GSFC/Arizona State University

Tuesday, December 7, 2010

Dione's Erulus Crater


The Cassini spacecraft snapped this shot of cratered Dione as it flew by the Saturnian moon on October 17, 2010.

The large crater at the center of the image is Erulus, which is about 120 kilometers, or 75 miles, across. This view looks toward the southern latitudes of the leading hemisphere of Dione (1,123 kilometers, or 698 miles across).

The image was taken in visible light with the Cassini spacecraft narrow-angle camera. The view was acquired at a distance of approximately 41,000 kilometers (25,000 miles) from Dione and at a Sun-Dione-spacecraft, or phase, angle of 53 degrees. Image scale is 240 meters (787 feet) per pixel.

Photo credit: NASA/JPL/Space Science Institute