Pages

Tuesday, November 30, 2010

Jupiter Shows First Signs of its Returning Belt


This image is a composite of three color images taken on November 18, 2010, by the Gemini North telescope in Hawaii. The composite image shows a belt that had previously vanished in Jupiter's atmosphere is now reappearing.

The three images used to make the composite were taken at three different parts of the infrared spectrum – 2.12 microns (blue), 1.69 microns (yellow) and 4.68 microns (red). At 1.69 microns, scientists see sunlight reflected from Jupiter's main cloud deck – the same clouds they see in visible light. At 2.12 microns, scientists see sunlight reflected from higher-altitude particles well above the main deck. At 4.68 microns, scientists see thermal emission arising from the tops of Jupiter's clouds, with the hottest emissions coming from the deepest atmosphere and signifying regions with minimal overlying cloud cover.

The region just to the left of the center, inside the white box, shows the region of the South Equatorial Belt with an unusually bright spot, or outbreak. One thing scientists were looking for in infrared was evidence that the darker material emerging to the west of the bright spot was the start of the clearing of the cloud deck. The particles lofted by the initial outbreak are easily identified in yellow as high-altitude particles at the upper right, with a second outbreak to the lower left. In the coming weeks, further outbreaks are expected to take place to the west (left) of those seen in this image, and the clear atmospheric regions will begin to fill this latitude band at the same time as the dark brown color typical of this region returns.

Photo credit: NASA/JPL/UH/NIRI/Gemini/UC Berkeley

Monday, November 29, 2010

Binary Star OGLE-LMC-CEP0227


By discovering the first double star where a pulsating Cepheid variable and another star pass in front of one another, an international team of astronomers has solved a decades-old mystery. The rare alignment of the orbits of the two stars in the double star system has allowed a measurement of the Cepheid mass with unprecedented accuracy. Up to now astronomers had two incompatible theoretical predictions of Cepheid masses. The new result shows that the prediction from stellar pulsation theory is spot on, while the prediction from stellar evolution theory is at odds with the new observations.

...

Classical Cepheid Variables, usually called just Cepheids, are unstable stars that are larger and much brighter than the Sun [1]. They expand and contract in a regular way, taking anything from a few days to months to complete the cycle. The time taken to brighten and grow fainter again is longer for stars that are more luminous and shorter for the dimmer ones. This remarkably precise relationship makes the study of Cepheids one of the most effective ways to measure the distances to nearby galaxies and from there to map out the scale of the whole Universe [2].

Unfortunately, despite their importance, Cepheids are not fully understood. Predictions of their masses derived from the theory of pulsating stars are 20–30% less than predictions from the theory of the evolution of stars. This embarrassing discrepancy has been known since the 1960s.

To resolve this mystery, astronomers needed to find a double star containing a Cepheid where the orbit happened to be seen edge-on from Earth. In these cases, known as eclipsing binaries, the brightness of the two stars dims as one component passes in front of the other, and again when it passes behind the other star. In such pairs astronomers can determine the masses of the stars to high accuracy [3]. Unfortunately neither Cepheids nor eclipsing binaries are common, so the chance of finding such an unusual pair seemed very low. None are known in the Milky Way.

“Very recently we actually found the double star system we had hoped for among the stars of the Large Magellanic Cloud. It contains a Cepheid variable star pulsating every 3.8 days. The other star is slightly bigger and cooler, and the two stars orbit each other in 310 days. The true binary nature of the object was immediately confirmed when we observed it with the HARPS spectrograph on La Silla.”

The observers carefully measured the brightness variations of this rare object, known as OGLE-LMC-CEP0227 [4], as the two stars orbited and passed in front of one another. They also used HARPS and other spectrographs to measure the motions of the stars towards and away from the Earth — both the orbital motion of both stars and the in-and-out motion of the surface of the Cepheid as it swelled and contracted.

This very complete and detailed data allowed the observers to determine the orbital motion, sizes and masses of the two stars with very high accuracy — far surpassing what had been done before for a Cepheid. The mass of the Cepheid is now known to about 1% and agrees exactly with predictions from the theory of stellar pulsation. However, the larger mass predicted by stellar evolution theory was shown to be significantly in error.

The much-improved mass estimate is only one outcome of this work, and the team hopes to find other examples of these remarkably useful pairs of stars to exploit the method further. They also believe that from such binary systems they will eventually be able to pin down the distance to the Large Magellanic Cloud to 1%, which would mean an extremely important improvement of the cosmic distance scale.

Notes:
[1] The first Cepheid variables were spotted in the 18th century and the brightest ones can easily be seen to vary from night to night with the unaided eye. They take their name from the star Delta Cephei in the constellation of Cepheus (the King), which was first seen to vary by John Goodricke in England in 1784. Remarkably, Goodricke was also the first to explain the light variations of another kind of variable star, eclipsing binaries. In this case two stars are in orbit around each other and pass in front of each other for part of their orbits and so the total brightness of the pair drops. The very rare object studied by the current team is both a Cepheid and an eclipsing binary. Classical Cepheids are massive stars, distinct from similar pulsating stars of lower mass that do not share the same evolutionary history.

[2] The period luminosity relation for Cepheids, discovered by Henrietta Leavitt in 1908, was used by Edwin Hubble to make the first estimates of the distance to what we now know to be galaxies. More recently Cepheids have been observed with the Hubble Space Telescope and with the ESO VLT on Paranal to make highly accurate distance estimates to many nearby galaxies.

[3] In particular, astronomers can determine the masses of the stars to high accuracy if both stars happen to have a similar brightness and therefore the spectral lines belonging to each of the two stars can be seen in the observed spectrum of the two stars together, as is the case for this object. This allows the accurate measurement of the motions of both stars towards and away from Earth as they orbit, using the Doppler effect.

[4] The name OGLE-LMC-CEP0227 arises because the star was first discovered to be a variable during the OGLE search for gravitational microlensing.

Illustration credit: ESO/L. Calçada

Sunday, November 28, 2010

Smooth Floor in Copernicus Crater


With the exception of recent impacts (such as this one) into the floor material of Copernicus, much of the northwestern floor of Copernicus appears smooth and relatively featureless (upper right corner). This region on the crater floor appears similar to mare basalt flows, but studies show that volcanism has not shaped the landscape of Copernicus' interior. Instead, it is possible that a vast volume of impact melt was created during impact and cooled differentially across the crater floor such that some areas appear smooth while others are hummocky. LROC NAC M135317661L, image width is 520 meters (1706 feet).

Photo credit: NASA/GSFC/Arizona State University

Saturday, November 27, 2010

Nile River Delta at Night


The Nile River and its delta look like a brilliant, long-stemmed flower in this astronaut photograph of the southeastern Mediterranean Sea, as seen from the International Space Station. The Cairo metropolitan area forms a particularly bright base of the flower. The smaller cities and towns within the Nile Delta tend to be hard to see amidst the dense agricultural vegetation during the day. However, these settled areas and the connecting roads between them become clearly visible at night. Likewise, urbanized regions and infrastructure along the Nile River becomes apparent (see also The Great Bend of Nile, Day & Night.)

Another brightly lit region is visible along the eastern coastline of the Mediterranean — the Tel-Aviv metropolitan area in Israel (image right). To the east of Tel-Aviv lies Amman, Jordan. The two major water bodies that define the western and eastern coastlines of the Sinai Peninsula — the Gulf of Suez and the Gulf of Aqaba — are outlined by lights along their coastlines (image lower right). The city lights of Paphos, Limassol, Larnaca, and Nicosia are visible on the island of Cyprus (image top).

Scattered blue-grey clouds cover the Mediterranean Sea and the Sinai, while much of northeastern Africa is cloud-free. A thin yellow-brown band tracing the Earth’s curvature at image top is airglow, a faint band of light emission that results from the interaction of atmospheric atoms and molecules with solar radiation at approximately 100 kilometers (60 miles) altitude.

Photo credit: NASA

Friday, November 26, 2010

Bent Galactic Jets in Abell 1763


Astronomers have caught sight of an unusual galaxy that, like a lighthouse, has illuminated new details about a celestial "sandbar" connecting two massive islands of galaxies. The galaxy, which is wandering through this sandbar, or filament, has twin lobes of material jetting from its center that are bending backwards as they sweep through the filament's hot gas. The findings are a result of observations made primarily by NASA's Spitzer Space Telescopes and the Very Large Array radio telescope near Socorro, New Mexico.

In this diagram, one of the clusters is shown to the right as a collection of galaxies, which are seen as dots. The hot gas filling the cluster and filament is illustrated with purple. The unusual galaxy and the angle of its bent lobes are illustrated in the callout.

In 2008, Spitzer identified this filament, which runs from a galaxy cluster known as Abell 1763. Later, Spitzer data helped narrow in on the unusual galaxy, and led to follow-up radio observations that were that were used to find and measure the angles of the lobes. Astronomers measured the curve of these lobes to gauge the density of particles in the intergalactic filament. Such rare, arced galaxies could be used to find and study the hard-to-see intergalactic filaments that link up galaxy clusters and offer ideal environments for forming new stars.

Infrared-bright galaxies measured by Spitzer are represented in the diagram with blue colors, and the brightest "starburst" galaxies are the largest dots. Radio-bright galaxies, including the one sweeping through the filament, are shaded green.

Illustration credit: NASA/JPL-Caltech

Thursday, November 25, 2010

AE Aurigae and the Flaming Star Nebula


NASA's Wide-field Infrared Survey Explorer, or WISE, captured this view of a runaway star racing away from its original home. Seen here surrounded by a glowing cloud of gas and dust, the star AE Aurigae appears to be on fire. Appropriately, the cloud is called the Flaming Star Nebula.

A runaway star is one that is hurled into high-speed motion through a supernova explosion or encounter with nearby stars. Like an angry teenager who storms out of the house after a family fight, runaway stars are ejected from their birthplace and race off to other parts of the galaxy.

The runaway star AE Aurigae was likely born in the Trapezium cluster, which is located in the constellation Orion. It formed as a binary-star system with the star Mu Columbae. Approximately 2.5 million years ago, these two stars are thought to have collided with another binary-star system in the Trapezium Cluster. This collision sent both AE Aurigae and Mu Columbae hurtling through space in opposite directions at a speed of 100 kilometers per second (over 200,000 miles per hour). Today, AE Aurigae can be seen in the constellation Auriga hundreds of light-years to the north of its home, while its former companion Mu Columbae is located hundreds of light-years to the south in the constellation Columba.

The wind from AE Aurigae blows away electrons from the gas surrounding it. This ionized gas begins to emit light, creating what is known as an emission nebula. The star also heats up nearby dust, causing it to glow in infrared wavelengths. As seen in visible light, this dust reflects the light of nearby stars, so it is called a reflection nebula.

The colors seen in this image represent specific wavelengths of infrared light. Hot stars scattered throughout the image show up as blue and cyan. Blue represents light emitted at wavelengths of 3.4 microns, while cyan represents 4.6 microns. The gas of the emission nebula appears green, representing 12-micron wavelengths. The dust of the reflection nebula appears primarily red, representing 22-micron light.

One interesting aspect of this image is that the edges of the reflection nebula appear lavender. This is because at its edges the nebula is both emitting light at longer, 22-micron wavelengths, and scattering shorter, 3.4-micron light. Since WISE represents 22-micron light as red and 3.4-micron light as blue, the combination of the two appears in this image as lavender.

Photo credit: NASA/JPL-Caltech/UCLA

Wednesday, November 24, 2010

ESOcast: First Planet of an Extragalactic Origin

Loading player...

An exoplanet orbiting a star that entered our galaxy, the Milky Way, from another galaxy has been detected by a European team of astronomers using the MPG/ESO 2.2-meter telescope at ESO’s La Silla Observatory in Chile. The Jupiter-like planet is particularly unusual, as it is orbiting a star nearing the end of its life and could be about to be engulfed by it, giving clues about the fate of our own planetary system in the distant future.

Video credit: ESO

Note: For more information, illustrations and videos about this story, see Planet from Another Galaxy Discovered.

Tuesday, November 23, 2010

Galactic Fountains


This illustration of the Milky Way shows the galactic fountain scenario: supernova explosions in the galactic disc heat the interstellar medium and can drive hot gas out of the disc, creating so-called galactic fountains that contribute to the formation of a halo of hot gas around the Milky Way. As the gas rises above and below the disc, reaching heights of a few kiloparsecs, it emits radiation and thus becomes cooler, condensing into clouds which then fall back into the disc, in a fashion that resembles a fountain.

The fountains shown in this illustration are purely indicative, as the number of fountains actually present in the Milky Way is not well known.

In this illustration the approximate scale of the galactic fountains is compared to the size of the Galaxy; the approximate location of the Sun is also indicated. Distances are given in kiloparsec (kpc).

Illustration credit: European Space Agency

Note: For more information, see New Evidence for Supernova-Driven Galactic Fountains in the Milky Way.

Monday, November 22, 2010

Anaglyph of Comet Hartley 2


This 3-D image shows the entire nucleus of Hartley 2 with jets and an icy particle cloud. Circles have been added to highlight the location of individual particles.

The images used to make this 3-D image, known as an anaglyph, were obtained by the Medium-Resolution Imager on November 4, 2010, the day the EPOXI mission spacecraft made its closest approach to the comet.

This 3-D image should be seen with blue-red glasses, where the red lens is in front of the left eye.

Photo credit: NASA/JPL-Caltech/UMD/Brown

The Many Faces of Comet Hartley 2


Infrared scans of Comet Hartley 2 by NASA's EPOXI mission spacecraft show carbon dioxide, dust, and ice being distributed in a similar way and emanating from apparently the same locations on the nucleus. Water vapor, however, has a different distribution implying a different source region and process.

These maps were made from data obtained by the High-Resolution Imager on November 4, 2010.

Photo credit: NASA/JPL-Caltech/UMD

Sunday, November 21, 2010

More on Comet 103/P Hartley 2


The Medium-Resolution Instrument on NASA's EPOXI mission spacecraft obtained these views of the icy particle cloud around Comet Hartley 2. The image on the left is the full image of Comet Hartley 2 for context, and the image on the right was enlarged and cropped.

The images confirm that the particles seen in the High-Resolution Instrument images are real and not artifacts.

This image was obtained on November 4, 2010, the day the EPOXI mission spacecraft made its closest approach to the comet.


This image from the High-Resolution Instrument on NASA's EPOXI mission spacecraft shows part of the nucleus of Comet Hartley 2. The Sun is illuminating the nucleus from the right. A distinct cloud of individual particles is visible. This image was obtained on November 4, 2010, the day the EPOXI mission spacecraft made its closest approach to the comet.


This zoomed-in image from the High-Resolution Instrument on NASA's EPOXI mission spacecraft shows the particles swirling in a "snow storm" around the nucleus of Comet Hartley 2.

Scientists estimate the size of the largest particles ranges from a golf ball to a basketball. They have determined these are icy particles rather than dust. The particles are believed to be very porous and fluffy.

The Sun is illuminating the nucleus from the right. This image was obtained on November 4, 2010, the day the EPOXI mission spacecraft made its closest approach to the comet.

Photo credits: (Top) NASA/JPL-Caltech/UMD/Brown; (Middle and Bottom) NASA/JPL-Caltech/UMD

Saturday, November 20, 2010

Merging Starburst Galaxies II Zw 096


A brilliant burst of star formation is revealed in this image combining observations from NASA's Spitzer and Hubble Space Telescopes. The collision of two spiral galaxies has triggered this luminous starburst, the brightest ever seen away from the centers, or nuclei, of merging galaxies.

The merging galaxies, known collectively as II Zw 096, can be clearly seen at shorter wavelengths of light from Hubble (blue hues).

The real action in this galactic train wreck jumps out in Spitzer's infrared view, represented in red. The brightest glow is from a tiny region that may be as small as 700 light-years across -- just a small portion of the full 50,000 light-year extent of II Zw 096. This region blasts out 80 percent of the infrared light from this galactic tumult. The surrounding shroud of dust renders the stars here nearly invisible in other wavelengths of light.

Researchers were surprised to see such a brilliant infrared glow in an area so far offset from the center of the merging spiral galaxy. Starbursts are often found crammed into the very centers of merging galaxies, but this is the brightest starburst ever seen outside a galaxy's nucleus. Based on Spitzer data, researchers estimate the starburst is cranking out stars at the breakneck pace of around 100 solar masses (100 times the mass of our Sun) per year.

In this combined image, Hubble's far-ultraviolet and visible light at wavelengths of 0.15 and 0.44 microns is shown in blue, and near-infrared light at 0.9 microns is cyan. Spitzer's infrared light at 4.5 microns is represented by orange, and mid-infrared light at 8.0 and 24 microns is red.

Photo credit: NASA/JPL-Caltech/STScI

Friday, November 19, 2010

NGC 1514


This image composite shows two views of a puffy, dying star, or planetary nebula, known as NGC 1514. The view on the left is from a ground-based, visible-light telescope; the view on the right shows the object in infrared light, as seen by NASA's Wide-field Infrared Survey Explorer, or WISE.

The object is actually a pair of stars -- one star is a dying giant somewhat heavier and hotter than our Sun, and the other was an even larger star that has now contracted into a dense body called a white dwarf. As the giant star ages, it sheds some its outer layers of material to form a large bubble around the two stars. Jets of material from the white dwarf are thought to have smashed into this bubble wall. The areas where the jets hit the cavity walls appear as orange rings in the WISE image. This is because dust in the rings is being heated and glows with infrared light that WISE detects.

The green cloud seen in the WISE view is an inner shell of previously shed material. In the visible image, this shell is seen in bright, light blues. An outer shell can also be seen in the visible image in more translucent shades of blue. This outer shell is too faint to be seen by WISE.

NGC 1514 is located 800 light-years away, in the constellation Taurus.

In the WISE image, infrared light with a wavelength of 3.4 microns is blue; 4.6-micron light is cyan; 12-micron light is green; and 22-micron light is red.

The visible-light image is from the Digitized Sky Survey, based at the Space Telescope Science Institute in Baltimore, Maryland.


Photo credits: NASA/JPL-Caltech/UCLA/DSS; NASA/JPL-Caltech/UCLA

Note: For more information on the bottom photo, see PIA13445: Cosmic Ocean Dweller.

Thursday, November 18, 2010

Hydrothermal Mineral Deposits at Nili Patera


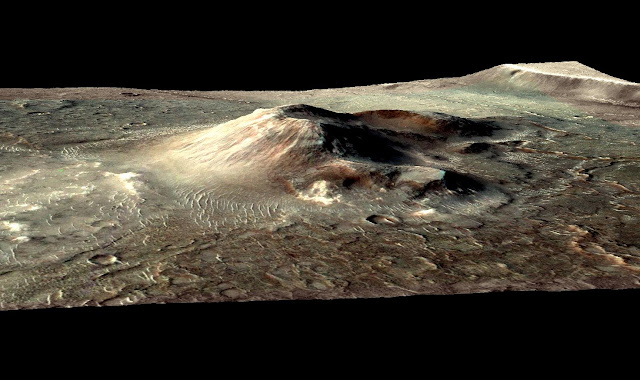
This volcanic cone in the Nili Patera caldera on Mars has hydrothermal mineral deposits on the southern flanks and nearby terrains. Two of the largest deposits are marked by arrows [see below], and the entire field of light-toned material on the left of the cone is hydrothermal deposits. The cone is about 5 kilometers (3 miles) in diameter at the base.

The deposits are evidence for a past local environment that was warm and wet or steamy, possibly hospitable to microbial life, as reported in a November 2010 Nature Geoscience paper by J.R. Skok, of Brown University, Providence, R.I., and co-authors.

This image is in false color derived from observation in infrared wavebands with the Compact Reconnaissance Imaging Spectrometer for Mars (CRISM) on NASA's Mars Reconnaissance Orbiter. The CRISM spectral data is overlaid on imagery from the Context Camera on that orbiter. A stereo pair of Context Camera images provided topographic information for a digital terrain model produced with NASA Ames Stereo Pipeline software. The image uses no vertical exaggeration.


Photo credit: NASA/JPL-Caltech/MSSS/JHU-APL/Brown University

Tuesday, November 16, 2010

Youngest Nearby Black Hole: SN 1979C in Messier 100


This composite image shows a supernova within the galaxy M100 that may contain the youngest known black hole in our cosmic neighborhood. In this image, Chandra’s X-rays are colored gold, while optical data from ESO’s Very Large Telescope are shown in red, green, and blue, and infrared data from Spitzer are red. The location of the supernova, known as SN 1979C, is labeled.

SN 1979C was first reported to be seen by an amateur astronomer in 1979. The galaxy M100 is located in the Virgo Cluster about 50 million light years from Earth. This approximately 30-year age, plus its relatively close distance, makes SN 1979C the nearest example where the birth of a black hole has been observed, if the interpretation by the scientists is correct.

Data from Chandra, as well as NASA's Swift, the European Space Agency's XMM-Newton and the German ROSAT observatory revealed a bright source of X-rays that has remained steady for the 12 years from 1995 to 2007 over which it has been observed. This behavior and the X-ray spectrum, or distribution of X-rays with energy, support the idea that the object in SN 1979C is a black hole being fed either by material falling back into the black hole after the supernova, or from a binary companion.

The scientists think that SN 1979C formed when a star about 20 times more massive than the Sun collapsed. It was a particular type of supernova where the exploded star had ejected some, but not all of its outer, hydrogen-rich envelope before the explosion, so it is unlikely to have been associated with a gamma-ray burst (GRB). Supernovas have sometimes been associated with GRBs, but only where the exploded star had completely lost its hydrogen envelope. Since most black holes should form when the core of a star collapses and a gamma-ray burst is not produced, this may be the first time that the common way of making a black hole has been observed.

The very young age of about 30 years for the black hole is the observed value, that is the age of the remnant as it appears in the image. Astronomers quote ages in this way because of the observational nature of their field, where their knowledge of the Universe is based almost entirely on the electromagnetic radiation received by telescopes.

Photo credits: X-ray: NASA/CXC/SAO/D.Patnaude et al, Optical: ESO/VLT, Infrared: NASA/JPL/Caltech


This animation shows how a black hole may have formed in SN 1979C. The collapse of a massive star is shown, after it has exhausted its fuel. A flash of light from a shock breaking through the surface of the star is then shown, followed by a powerful supernova explosion. The view then zooms into the center of the explosion.

Video credits: NASA/CXC/A.Hobart

Note: For more information, see NASA's Chandra Finds Youngest Nearby Black Hole.

Monday, November 15, 2010

Galaxy Cluster 3C 186


3C186: A galaxy cluster with a central quasar located about 8 billion light years away.

This composite image contains a new, deep image from Chandra (blue) showing emission from gas surrounding the point-like quasar near the center of the galaxy cluster known as 3C 186. Optical data from the Gemini telescope (yellow) show the stars and galaxies in the field of view. Chandra X-ray spectra reveal that the temperature of the gas drops from 80 million degrees on the outskirts of the cluster down to 30 million in the core. This drop in temperature occurs because intense X-ray emission from the gas cools it. 3C 186 is the most distant such object observed, and could provide insight into the triggering of quasars and the growth of galaxy clusters.

Scale: Image is 4.6 by 3.4 arcminutes (10.7 by 7.9 million light years).

Photo credit: X-ray: NASA/CXC/SAO/A.Siemiginowska et al, Optical: AURA/Gemini Observatory

Note: More information and photos can be found at 3C186: Precocious Galaxy Cluster Identified by Chandra.

Sunday, November 14, 2010

NGC 7252 "Atoms for Peace"


European Southern Observatory astronomers have produced a spectacular new image of the famous Atoms-for-Peace galaxy (NGC 7252). This galactic pile-up, formed by the collision of two galaxies, provides an excellent opportunity for astronomers to study how mergers affect the evolution of the Universe.

Atoms-for-Peace is the curious name given to a pair of interacting and merging galaxies that lie around 220 million light-years away in the constellation of Aquarius. It is also known as NGC 7252 and Arp 226 and is just bright enough to be seen by amateur astronomers as a very faint small fuzzy blob. This very deep image was produced by ESO’s Wide Field Imager on the MPG/ESO 2.2-meter telescope at ESO’s La Silla Observatory in Chile.

A galaxy collision is one of the most important processes influencing how our Universe evolves, and studying them reveals important clues about galactic ancestry. Luckily, such collisions are long drawn-out events that last hundreds of millions of years, giving astronomers plenty of time to observe them.

This picture of Atoms-for-Peace represents a snapshot of its collision, with the chaos in full flow, set against a rich backdrop of distant galaxies. The results of the intricate interplay of gravitational interactions can be seen in the shapes of the tails made from streams of stars, gas and dust. The image also shows the incredible shells that formed as gas and stars were ripped out of the colliding galaxies and wrapped around their joint core. While much material was ejected into space, other regions were compressed, sparking bursts of star formation. The result was the formation of hundreds of very young star clusters, around 50 to 500 million years old, which are speculated to be the progenitors of globular clusters.

Atoms-for-Peace may be a harbinger of our own galaxy’s fate. Astronomers predict that in three or four billion years the Milky Way and the Andromeda Galaxy will collide, much as has happened with Atoms-for-Peace. But don’t panic: the distance between stars within a galaxy is vast, so it is unlikely that our Sun will end up in a head-on collision with another star during the merger.

The object’s curious nickname has an interesting history. In December 1953, President Eisenhower gave a speech that was dubbed Atoms for Peace. The theme was promoting nuclear power for peaceful purposes — a particularly hot topic at the time. This speech and the associated conference made waves in the scientific community and beyond to such an extent that NGC 7252 was named the Atoms-for-Peace galaxy. In many ways, this is oddly appropriate: the curious shape that we can see is the result of two galaxies merging to produce something new and grand, a little like what occurs in nuclear fusion. Furthermore, the giant loops resemble a textbook diagram of electrons orbiting an atomic nucleus.

Photo credit: European Southern Observatory

Saturday, November 13, 2010

Dark Matter in Abell 1689


This NASA Hubble Space Telescope image shows the distribution of dark matter in the center of the giant galaxy cluster Abell 1689, containing about 1,000 galaxies and trillions of stars.

Dark matter is an invisible form of matter that accounts for most of the universe's mass. Hubble cannot see the dark matter directly. Astronomers inferred its location by analyzing the effect of gravitational lensing, where light from galaxies behind Abell 1689 is distorted by intervening matter within the cluster.

Researchers used the observed positions of 135 lensed images of 42 background galaxies to calculate the location and amount of dark matter in the cluster. They superimposed a map of these inferred dark matter concentrations, tinted blue, on an image of the cluster taken by Hubble's Advanced Camera for Surveys. If the cluster's gravity came only from the visible galaxies, the lensing distortions would be much weaker. The map reveals that the densest concentration of dark matter is in the cluster's core.

Abell 1689 resides 2.2 billion light-years from Earth. The image was taken in June 2002.

Photo credit: NASA/JPL-Caltech/ESA/Institute of Astrophysics of Andalusia, University of Basque Country/JHU

Friday, November 12, 2010

Comet 103/P Hartley 2 by Herschel/Spire


This Herschel/SPIRE image of Comet 103P/Hartley 2 was taken on 24 October 2010 at 250 microns, and covers a region of 8 arcminutes x 5 arcminutes. At the time that this image was obtained the comet was at a distance of 17.2 million km from the Herschel Space Observatory.

Herschel has obtained unique, sensitive far-infrared continuum images constraining the size of the large dust particles, while spectra reveal the distribution of water molecules released from the nucleus as about 230 kg of ices evaporating every second. This is the first time a comet has been imaged in this region of the electromagnetic spectrum.

The Sun symbol and arrow indicate the projected direction towards the Sun.

Note:
Herschel is one of several observatories participating in a global astronomical campaign to observe and study the short period (6.46 years) Comet 103P/Hartley 2 before, during and after a flyby by the NASA EPOXI (Extrasolar Planet Observatory and Deep Impact Extended Investigation) mission on 4 November 2010.

In the period 24 October to 17 November 2010, Herschel will use its complement of state-of the-art instruments, covering the range 55-671 μm, to observe the far-infrared and submillimeter spectrum and to image the thermal dust radiation of Comet 103P/Hartley 2.

Photo credit: ESA/Herschel/HSSO Consortium

Note: For news about another satellite that has been observing Comet Hartley 2, see Odin Satellite Observes Water In Comet 103P Hartley 2.

Thursday, November 11, 2010

Brown Dwarf WISEPC J045853.90+643451.9


That green dot in the middle of this image might look like an emerald amidst glittering diamonds, but it is actually a dim star belonging to a class called brown dwarfs. This particular object, named "WISEPC J045853.90+643451.9" after its location in the sky, is the first ultra-cool brown dwarf discovered by NASA's Wide-field Infrared Survey Explorer, or WISE. WISE is scanning the skies in infrared light, picking up the signatures of all sort of cosmic gems, including brown dwarfs.

The mission's infrared vision makes it particularly good at picking brown dwarfs out of a starry sky. This view shows three of WISE's four infrared channels, color-coded blue, green and red, with blue showing the shortest wavelengths of infrared light and red, the longest. The methane in the atmospheres of brown dwarfs absorbs this color-coded blue light, and the objects themselves are too faint to give off a lot of the red light. That leaves green. As can be seen in this picture, the little green dot of a brown dwarf stands out against the sparkly, hotter blue stars.

The brown dwarf is located 18 to 30 light-years away in the northern constellation of Camelopardalis, or the giraffe; in fact, the brown dwarf is positioned right on the neck of the giraffe, adorning it like an emerald necklace. This is one of the coolest brown dwarfs known, with a temperature of roughly 600 Kelvin, or 620 degrees Fahrenheit.

Photo credit: NASA/JPL-Caltech/UCLA

Wednesday, November 10, 2010

SDP 81


This image composite shows a warped and magnified view of a galaxy discovered by the Herschel Space Observatory, one of five such galaxies uncovered by the infrared telescope. The galaxy -- referred to as "SDP 81" -- is the yellow dot in the left image taken by Herschel. It can also be seen as the pink smudges in the right image, a composite of ground-based observations showing more detail.

Herschel was able to find the galaxy, which is buried in dust, because it happens to be positioned behind another galaxy (blue blob at right), which is acting like a cosmic lens to make it appear brighter. The gravity of the foreground galaxy is distorting and magnifying the distant galaxy's light, causing it to appear in multiple places, as seen as the pink smudges. The distant galaxy is so far away that its light took about 11 billion years to reach us.

Herschel couldn't detect the foreground galaxy, but astronomers were able to spot it in visible light using the W.M. Keck Observatory. Several follow-up observations by ground telescopes helped to get a better view of the distant galaxy. For example, the pink smudges at the right show wavelengths that are even longer than what Herschel sees in the submillimeter portion of the electromagnetic spectrum. Those observations were made by the Smithsonian Astrophysical Observatory's Submillimeter Array in Hawaii.

Photo credit: ESA/NASA/JPL-Caltech/Keck/SMA

Note: For more information see Herschel's Hidden Talent: Digging Up Magnified Galaxies.

Tuesday, November 9, 2010

Evidence for a First-of-Its-Kind Comet Jet


These three pairs of images from NASA's EPOXI mission demonstrate that a dust jet and gaseous carbon dioxide are being released from Comet Hartley 2 at the same time, and from the same location on the comet. The observations suggest that carbon dioxide is driving the jet and taking tiny grains with it as it spews out of the nucleus of the comet. This is the first time this type of jet has been observed.

The top row consists of three images showing carbon dioxide gas being released by the comet at different points in time, from when the comet was at its minimum brightness to its maximum brightness. The bottom row of images shows dust coming from a jet on the comet at the same three points in time. The observations demonstrate that the gas and the jet are coming from the same location on the comet at the same time. This, in turn, suggests that the carbon dioxide is driving the jet.

The presence of this jet tells the scientists that the comet is made of chunks rich in solid carbon dioxide, sort of like chocolate chip chunks in frozen cookie dough. What's more, this variability in the comet's composition implies that the ingredients for both comets and planets must have been mixed up early on in the formation of our solar system. Without this mixing, comets would have more homogenous composition -- in simple terms, this would be having comets made of just "dough," and comets made of just "chocolate chunks."

The top-row images show data taken by the spacecraft's infrared spectrometer, a part of the High-Resolution Instrument. The bottom row images were taken in visible light by the spacecraft's Medium-Resolution Instrument.

Photo credit: NASA/JPL-Caltech/UMD